Stock Deep Dive · 2026-08-19
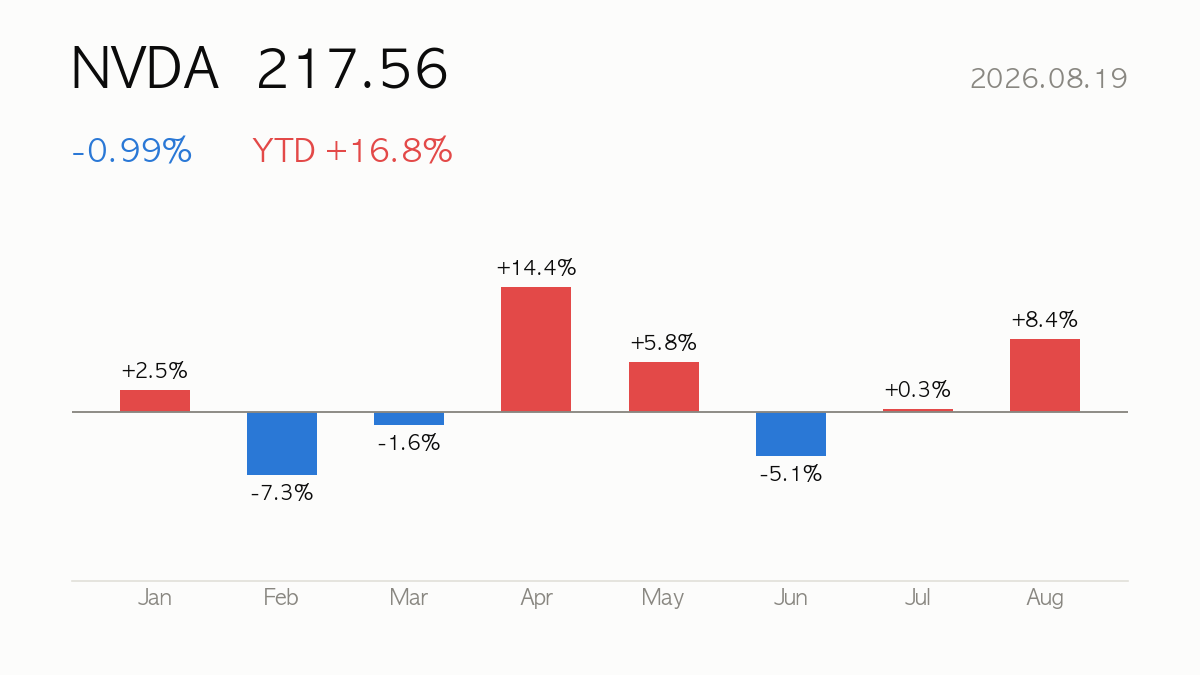
NVIDIA (NVDA) closed at $217.56, down 0.99% on the day. Year-to-date return is +16.8%, sitting at 74% of its 52-week range. Next earnings: 2026-08-26 (in 6 days).
|
Close
$217.56
-0.99% · YTD +16.8%
|
Market Cap
$5,269.52B
Semiconductors
|
Forward P/E
16.9x
PER 33.0x
|
52-wk Range
74%
High $236.54 · Low $164.07
|
🔔 Earnings land on 2026-08-26 — D-6. Volatility typically picks up around the print.
🔍 At a Glance
NVIDIA remains the linchpin of the AI infrastructure buildout, posting 85.2% quarterly revenue growth, a 64.0% operating margin, and a 114.3% ROE that few companies anywhere can match—numbers that justify a forward PER of just 16.9 and a PEG of 0.6 versus its trailing PER of 33.0. The bear case is valuation and crowding risk: PSR of 20.8, PBR of 33.5, and an RSI of 71.9 near overbought territory show a stock priced for perfection, sitting 11.6% above its 200-day average with competitive threats now openly debated by prominent investors.
🏢 How It Makes Money
NVIDIA’s Compute & Networking segment—data center GPUs, AI accelerators, and networking gear—is the profit engine behind the current growth surge, serving cloud providers, OEMs, and system integrators racing to build AI infrastructure. Its smaller Graphics segment (GeForce, Quadro/RTX) still anchors gaming and professional visualization, but the AI data center business now drives the outsized margins and growth investors are pricing in.
📈 Quarterly Results — Is Business Growing?
| Quarter | Revenue | Op. Income | Net Income | Op. Margin |
|---|---|---|---|---|
| 25Q2 | $44.06B | $21.64B | $18.77B | 49.1% |
| 25Q3 | $46.74B | $28.44B | $26.42B | 60.8% |
| 25Q4 | $57.01B | $36.01B | $31.91B | 63.2% |
| 26Q1 | $68.13B | $44.30B | $42.96B | 65.0% |
| 26Q2 | $81.61B | $53.54B | $58.32B | 65.6% |
Latest-quarter revenue up +85.2% versus the same quarter a year ago.

💡 Korea Market 101
⚖️ Valuation — Cheap or Expensive?
| Metric | Value | How to read it |
|---|---|---|
| P/E (trailing) | 33.0x | Price vs last 12 months’ earnings |
| P/E (forward) | 16.9x | Price vs next 12 months’ expected earnings — growth hopes baked in |
| P/S | 20.8x | Price vs revenue — for high-growth names with thin profits |
| P/B | 33.5x | Price vs book value — below 1x means priced under liquidation value |
| PEG | 0.6x | P/E ÷ growth — near 1 is fair for the growth; above 2 is demanding |
| EV/EBITDA | 31.9x | Enterprise value (incl. debt) vs cash generation |
Peer comparison
| Name | Mkt Cap | P/E | Fwd P/E | P/S |
|---|---|---|---|---|
| NVIDIA Corporation | $5,269.52B | 33.3x | 16.9x | 20.8x |
| Advanced Micro Devices, Inc. | $761.42B | 119.0x | 30.2x | 18.4x |
| Broadcom Inc. | $1,724.53B | 60.4x | 18.6x | 22.9x |
| Taiwan Semiconductor Manufactur | $2,137.29B | 30.9x | 18.9x | 0.5x |
💡 Korea Market 101
🎯 Street Consensus
- Price target (mean): $302.83
- Target high / low: $500.00 / $180.00
- Implied upside: +39.2%
- Rating: Strong Buy (1.3/5)
- Analysts covering: 58
- Next earnings: 2026-08-26
💡 Korea Market 101
📉 Price Action — Technical Check

| Indicator | Value | How to read it |
|---|---|---|
| RSI (14d) | 71.9 | Above 70 overbought · below 30 oversold |
| vs 60-day MA | +4.4% | Above/below the medium-term trend |
| vs 200-day MA | +11.6% | Above/below the long-term trend |
| Golden/death cross | 50-day above 200-day (bullish alignment) | 50-day MA crossing above (golden) or below (death) the 200-day |
| Volume (vs 20d avg) | 0.8x | 2x+ means a spike in market attention |
💡 Korea Market 101
📰 Recent News
- Is Nvidia stock too cheap right now? — Yahoo Finance
- Bank of America doubles down on Nvidia stock despite big risk — thestreet.com
- Going Into Earnings, Is Nvidia Stock a Buy, a Sell, or Fairly Valued? — Morningstar
- ‘Big Short’ investor Michael Burry unpacks ‘serious competition’ for Nvidia that he thinks could shake up the AI trade — Business Insider
- 8 Stocks Nvidia Has Invested In — US News Money
- The CEO of This Nvidia-Backed Artificial Intelligence (AI) Chip Company Just Bought $10 Million of His Own Stock. Here’s What He’s Seeing That Retail Investors Won’t Want to Miss. — The Motley Fool
How to read these headlines
The common thread across headlines—valuation debates, Bank of America’s bullish stance, and Michael Burry flagging “serious competition”—reflects a market wrestling with whether NVIDIA’s premium multiple still has room given decelerating share gains from rivals. The CEO stock purchase at an NVIDIA-backed chip company suggests insiders see continued AI capex strength, though competitive dynamics are worth confirming ahead of the August earnings date, as any share loss narrative could weigh on the premium valuation embedded in NVIDIA’s current PSR and PBR levels.
Headlines are credited to their publishers — click a headline to open the original article. The commentary is written by this site and does not represent the views of any publisher.
💡 Korea Market 101
🔭 Scenarios & What to Watch
The next earnings report on 2026-08-26 is the key catalyst—another beat like the recent 85.2% revenue growth would support the current strong_buy consensus (average target 302.83, range 180-500). Watch for signs of decelerating hyperscaler capex, any China-related export developments, and whether the RSI cooling from 71.9 signals near-term consolidation. A pullback toward the MA60 (+4.4%) could offer a healthier entry setup if fundamentals hold.
Next earnings on 2026-08-26 (in 6 days) — guidance usually decides the stock’s direction more than the reported quarter.
💡 Korea Market 101
📚 All stock analysis · More on NVIDIA · Market report for this session
Stock report · published 2026-08-20 07:25 KST
For information only — a summary of public data, not a recommendation to buy or sell any security. Source data (Yahoo Finance and others) may be delayed or contain errors. All investment decisions are your own responsibility.
Leave a Reply