NVIDIA (NVDA) — Report Archive
NVIDIA (NVDA) is listed on a US exchange. This page collects every Stock Rollbar deep dive on the stock — 3 reports covering 2026-07-20 ~ 2026-08-19, newest first. Each report is generated from exchange data and filings on its own reference date; the table below tracks how the close moved from one report to the next.
| Reference date | Close | Day | YTD |
|---|---|---|---|
| 2026-08-19 | $217.56 | -0.99% | +16.8% |
| 2026-08-03 | $206.64 | +2.93% | +10.9% |
| 2026-07-20 | $203.28 | +0.23% | +9.1% |
Figures are as of each report’s reference date, not live quotes.
-
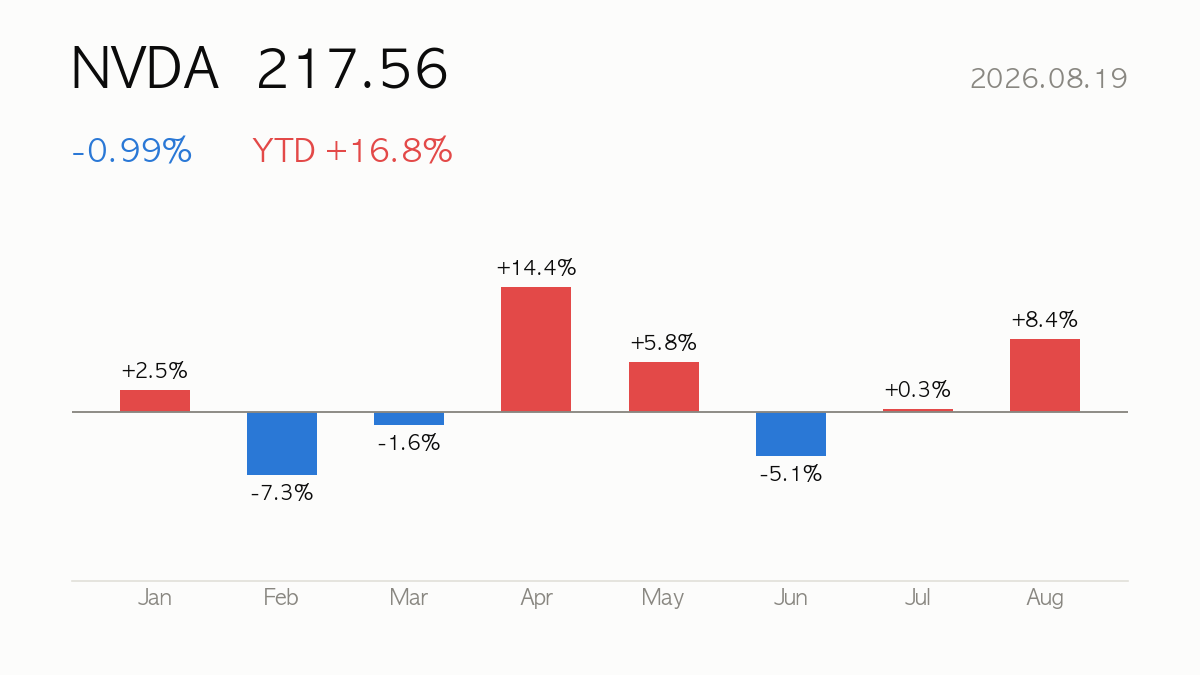
[Deep Dive] 2026.08.19 NVIDIA (NVDA) +17% YTD — Fundamentals, Valuation & Outlook
NVIDIA (NVDA) closed at $217.56, down 0.99% on the day. Year-to-date return is +16.8%, sitting at 74% of its 52-week range. Next…
-
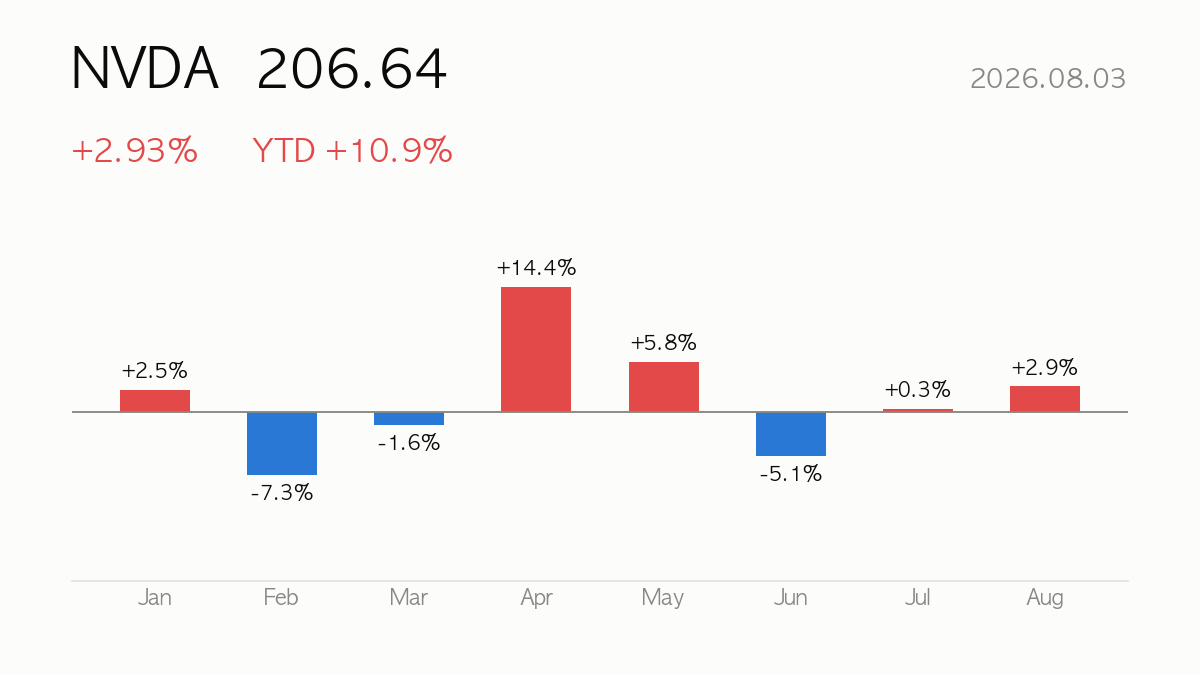
[Deep Dive] 2026.08.03 NVIDIA (NVDA) +11% YTD — Fundamentals, Valuation & Outlook
NVIDIA (NVDA) closed at $206.64, up 2.93% on the day. Year-to-date return is +10.9%, sitting at 59% of its 52-week range. Next…
-

[Deep Dive] 2026.07.20 NVIDIA (NVDA) +9% YTD — Fundamentals, Valuation & Outlook
NVIDIA (NVDA) closed at $203.28, up 0.23% on the day. Year-to-date return is +9.1%, sitting at 54% of its 52-week range. Next…