Stock Deep Dive · 2026-08-03
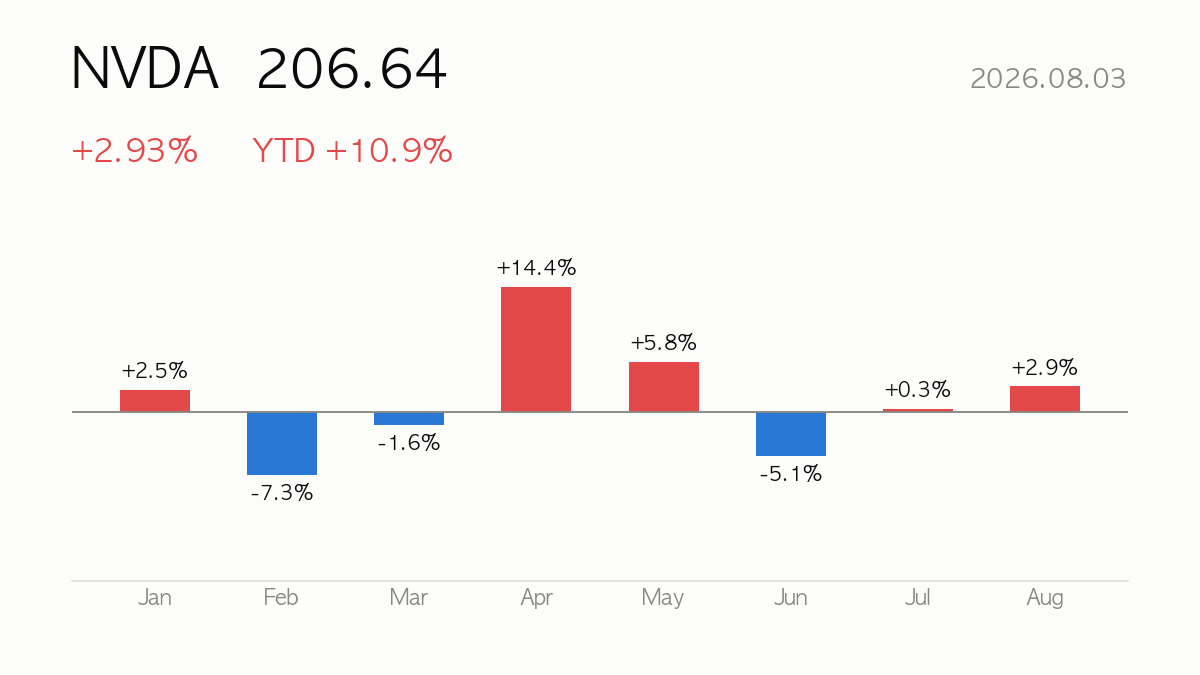
NVIDIA (NVDA) closed at $206.64, up 2.93% on the day. Year-to-date return is +10.9%, sitting at 59% of its 52-week range. Next earnings: 2026-08-26 (in 22 days).
|
Close
$206.64
+2.93% · YTD +10.9%
|
Market Cap
$5,005.03B
Semiconductors
|
Forward P/E
16.0x
PER 31.4x
|
52-wk Range
59%
High $236.54 · Low $164.07
|
🔍 At a Glance
NVIDIA closed at 206.64, up 2.93% on the day and 10.9% YTD, with revenue growing 85.2% year-over-year last quarter and a 64.0% operating margin that underscores its dominance in AI data-center compute. Bulls point to a forward PE of just 16.0 against a PEG of 0.6 as evidence growth is undervalued, while bears note trailing multiples (PER 31.4, PSR 19.7, PBR 31.8) remain rich and the stock has actually slipped 1.1% over three months despite the AI narrative.
🏢 How It Makes Money
NVIDIA’s Compute & Networking segment—data-center accelerators, AI software, and networking platforms—is the core profit engine, supplemented by automotive and autonomous-vehicle software. The Graphics segment, built on GeForce and Quadro/RTX GPUs, still serves gaming, PCs, and professional visualization, but with TTM revenue of $253.49B and ROE of 114.3%, the AI infrastructure buildout is clearly the dominant driver of both growth and profitability.
📈 Quarterly Results — Is Business Growing?
| Quarter | Revenue | Op. Income | Net Income | Op. Margin |
|---|---|---|---|---|
| 25Q2 | $44.06B | $21.64B | $18.77B | 49.1% |
| 25Q3 | $46.74B | $28.44B | $26.42B | 60.8% |
| 25Q4 | $57.01B | $36.01B | $31.91B | 63.2% |
| 26Q1 | $68.13B | $44.30B | $42.96B | 65.0% |
| 26Q2 | $81.61B | $53.54B | $58.32B | 65.6% |
Latest-quarter revenue up +85.2% versus the same quarter a year ago.

💡 Korea Market 101
⚖️ Valuation — Cheap or Expensive?
| Metric | Value | How to read it |
|---|---|---|
| P/E (trailing) | 31.4x | Price vs last 12 months’ earnings |
| P/E (forward) | 16.0x | Price vs next 12 months’ expected earnings — growth hopes baked in |
| P/S | 19.7x | Price vs revenue — for high-growth names with thin profits |
| P/B | 31.8x | Price vs book value — below 1x means priced under liquidation value |
| PEG | 0.6x | P/E ÷ growth — near 1 is fair for the growth; above 2 is demanding |
| EV/EBITDA | 29.1x | Enterprise value (incl. debt) vs cash generation |
Peer comparison
| Name | Mkt Cap | P/E | Fwd P/E | P/S |
|---|---|---|---|---|
| NVIDIA Corporation | $5,005.03B | 31.7x | 16.0x | 19.7x |
| Advanced Micro Devices, Inc. | $790.25B | 161.5x | 34.8x | 21.1x |
| Broadcom Inc. | $1,866.07B | 65.5x | 20.1x | 24.7x |
| Taiwan Semiconductor Manufactur | $2,106.28B | 35.7x | 18.8x | 0.5x |
💡 Korea Market 101
🎯 Street Consensus
- Price target (mean): $302.83
- Target high / low: $500.00 / $180.00
- Implied upside: +46.5%
- Rating: Strong Buy (1.3/5)
- Analysts covering: 58
- Next earnings: 2026-08-26
💡 Korea Market 101
📉 Price Action — Technical Check

| Indicator | Value | How to read it |
|---|---|---|
| RSI (14d) | 45.7 | Above 70 overbought · below 30 oversold |
| vs 60-day MA | -0.9% | Above/below the medium-term trend |
| vs 200-day MA | +7.0% | Above/below the long-term trend |
| Golden/death cross | 50-day above 200-day (bullish alignment) | 50-day MA crossing above (golden) or below (death) the 200-day |
| Volume (vs 20d avg) | 1.0x | 2x+ means a spike in market attention |
💡 Korea Market 101
📰 Recent News
- Nvidia Stock Retakes Key Level As Chip Stocks Waver — Investor’s Business Daily
- Nvidia Stock Slumps After Data-Center Report — WSJ
- 1 Unstoppable Stock to Buy Before It Joins Nvidia, Alphabet, Apple, and Microsoft in the $3 Trillion Club — Yahoo Finance
- Semiconductor Sell-Off: 1 Chip Stock to Buy, 1 to Hold, and 1 to Sell — The Motley Fool
- Here are Friday’s biggest analyst calls: Nvidia, SpaceX, Apple, Amazon, Coinbase, Reddit, Arm, Roblox & more — CNBC
- The ‘Nvidia Tax’: Alphabet Mitigates It Better Than Amazon or Any Other Mag 7 Stock — 24/7 Wall St.
How to read these headlines
The headlines share a common thread: nervousness about data-center demand durability and pricing power, from the WSJ’s report-driven slump to broader chip sector sell-off coverage. The “Nvidia Tax” narrative—suggesting hyperscalers like Alphabet are better insulated from NVIDIA’s pricing than peers—matters most, since it hints at customer pushback or diversification that could eventually pressure margins or unit volumes, a dynamic worth confirming in the upcoming earnings commentary.
Headlines are credited to their publishers — click a headline to open the original article. The commentary is written by this site and does not represent the views of any publisher.
💡 Korea Market 101
🔭 Scenarios & What to Watch
The next earnings report on 2026-08-26 will be the key test of whether 85%-plus growth can persist against tougher comparisons. With RSI at 45.7 and price sitting 0.9% below the 60-day average but 7.0% above the 200-day, the stock is in a neutral technical zone—watch for a break above MA60 to confirm momentum, or a slide toward the 52-week lower range (currently at 59% of band) if data-center demand headlines sour sentiment. Analyst targets range widely from 180.00 to 500.00, reflecting real dispersion in AI-spending forecasts.
Next earnings on 2026-08-26 (in 22 days) — guidance usually decides the stock’s direction more than the reported quarter.
💡 Korea Market 101
📚 All stock analysis · More on NVIDIA · Market report for this session
Stock report · published 2026-08-04 07:25 KST
For information only — a summary of public data, not a recommendation to buy or sell any security. Source data (Yahoo Finance and others) may be delayed or contain errors. All investment decisions are your own responsibility.
Leave a Reply