Stock Deep Dive · 2026-07-28
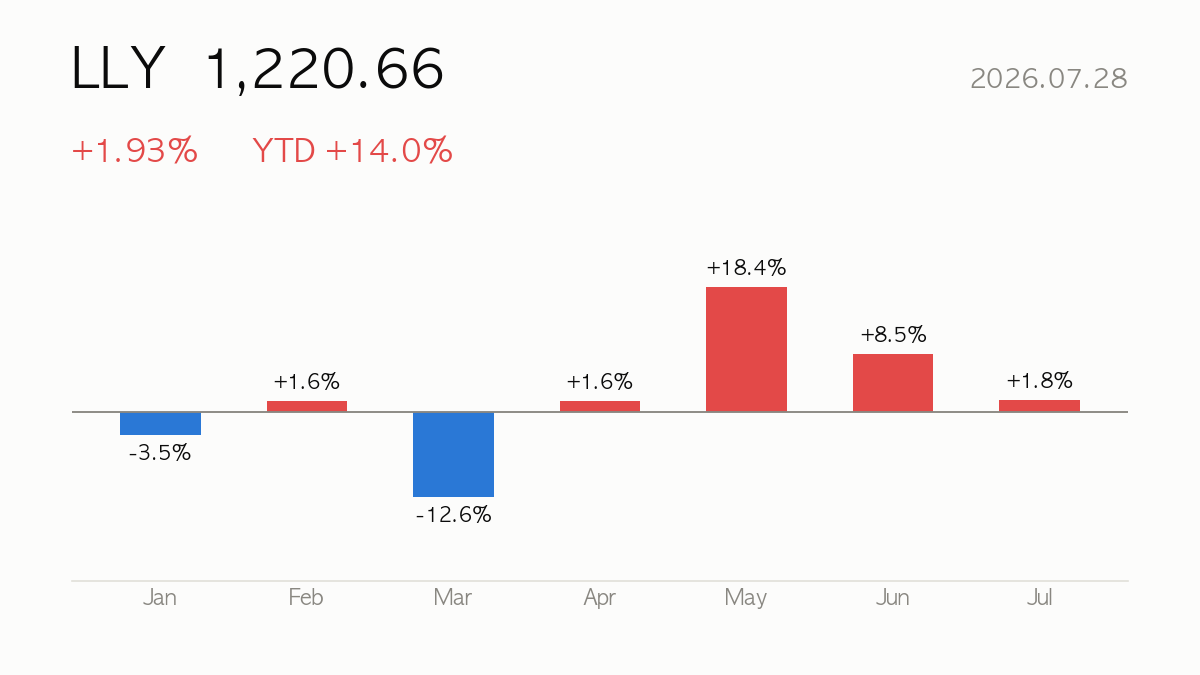
Eli Lilly (LLY) closed at $1,220.66, up 1.93% on the day. Year-to-date return is +14.0%, sitting at 95% of its 52-week range. Next earnings: 2026-08-05 (in 7 days).
|
Close
$1,220.66
+1.93% · YTD +14.0%
|
Market Cap
$1,088.51B
Drug Manufacturers – General
|
Forward P/E
27.1x
PER 43.1x
|
52-wk Range
95%
High $1,249.45 · Low $623.78
|
🔍 At a Glance
Eli Lilly is riding a genuine growth wave—revenue up 55.5% year-over-year to a $72.25B TTM base, with a 47.3% operating margin and a jaw-dropping 107.5% ROE, powered by Mounjaro and Zepbound’s GLP-1 dominance. But at 43.1x trailing earnings and 41.0x book value, sitting near 95% of its 52-week range, the stock leaves little room for error, and Goldman’s cautious commentary shows not everyone is convinced the premium is justified.
🏢 How It Makes Money
Lilly’s engine is split between cardiometabolic health—Mounjaro and Zepbound for diabetes and obesity, alongside legacy insulins like Humalog and Humulin—and a growing oncology franchise spanning Cyramza, Erbitux, Jaypirca, Retevmo, and newer entrant Inluriyo. The GLP-1 obesity and diabetes category is clearly the growth engine behind that eye-popping 55.5% quarterly revenue jump, while oncology and diabetes legacy products provide a diversified, cash-generative base.
📈 Quarterly Results — Is Business Growing?
| Quarter | Revenue | Op. Income | Net Income | Op. Margin |
|---|---|---|---|---|
| 25Q1 | $12.73B | $5.30B | $2.76B | 41.7% |
| 25Q2 | $15.56B | $7.02B | $5.66B | 45.1% |
| 25Q3 | $17.60B | $8.39B | $5.58B | 47.6% |
| 25Q4 | $19.29B | $8.99B | $6.64B | 46.6% |
| 26Q1 | $19.80B | $9.78B | $7.40B | 49.4% |
Latest-quarter revenue up +55.5% versus the same quarter a year ago.

💡 Korea Market 101
⚖️ Valuation — Cheap or Expensive?
| Metric | Value | How to read it |
|---|---|---|
| P/E (trailing) | 43.1x | Price vs last 12 months’ earnings |
| P/E (forward) | 27.1x | Price vs next 12 months’ expected earnings — growth hopes baked in |
| P/S | 15.1x | Price vs revenue — for high-growth names with thin profits |
| P/B | 41.0x | Price vs book value — below 1x means priced under liquidation value |
| PEG | 1.7x | P/E ÷ growth — near 1 is fair for the growth; above 2 is demanding |
| EV/EBITDA | 30.5x | Enterprise value (incl. debt) vs cash generation |
Peer comparison
| Name | Mkt Cap | P/E | Fwd P/E | P/S |
|---|---|---|---|---|
| Eli Lilly and Company | $1,088.51B | 43.4x | 27.1x | 15.1x |
| Novo Nordisk A/S | $225.34B | 12.2x | 15.6x | 0.7x |
| Merck & Company, Inc. | $325.57B | 37.2x | 13.7x | 5.0x |
| Pfizer, Inc. | $143.91B | 19.3x | 8.9x | 2.3x |
💡 Korea Market 101
🎯 Street Consensus
- Price target (mean): $1,276.96
- Target high / low: $1,600.00 / $850.00
- Implied upside: +4.6%
- Rating: Buy (1.7/5)
- Analysts covering: 26
- Next earnings: 2026-08-05
💡 Korea Market 101
📉 Price Action — Technical Check

| Indicator | Value | How to read it |
|---|---|---|
| RSI (14d) | 51.1 | Above 70 overbought · below 30 oversold |
| vs 60-day MA | +9.9% | Above/below the medium-term trend |
| vs 200-day MA | +20.0% | Above/below the long-term trend |
| Golden/death cross | 50-day above 200-day (bullish alignment) | 50-day MA crossing above (golden) or below (death) the 200-day |
| Volume (vs 20d avg) | 1.0x | 2x+ means a spike in market attention |
💡 Korea Market 101
📰 Recent News
- Does Eli Lilly Stock Actually Diversify Your Portfolio? — Trefis
- Eli Lilly (LLY) Stock Gets Fair Value Bump As Analysts Lift Targets On GLP1 Outlook — Yahoo Finance
- Eli Lilly, Dell Lead Five Stocks To Watch As Leadership Shifts — Investor’s Business Daily
- Goldman Sachs sees writing on the wall for Eli Lilly stock — thestreet.com
- Analysts’ Opinions Are Mixed on These Healthcare Stocks: Aurora Cannabis (ACB), Eli Lilly & Co (LLY) and Tyra Bioscience (TYRA) — The Globe and Mail
- Collect 9.8% On LLY Stock Now, Own It 30% Cheaper If It Dips — Trefis
💡 Korea Market 101
🔭 Scenarios & What to Watch
Bulls point to consensus targets averaging 1,276.96 (as high as 1,600) and analyst target hikes tied to GLP-1 optimism, with RSI at a neutral 51.1 suggesting room to run before overbought conditions. Bears should note the stock trades 20% above its 200-day average and 9.9% above its 60-day, a stretch that may weigh on near-term upside if growth decelerates. The next earnings report on 2026-08-05 is the key catalyst—watch for continued Mounjaro/Zepbound momentum and margin durability, both worth confirming before the premium valuation can be fully underwritten.
Next earnings on 2026-08-05 (in 7 days) — guidance usually decides the stock’s direction more than the reported quarter.
💡 Korea Market 101
📚 All stock analysis · More on Eli Lilly · Market report for this session
Stock report · published 2026-07-29 07:25 KST
For information only — a summary of public data, not a recommendation to buy or sell any security. Source data (Yahoo Finance and others) may be delayed or contain errors. All investment decisions are your own responsibility.
Leave a Reply