Stock Deep Dive · 2026-08-05
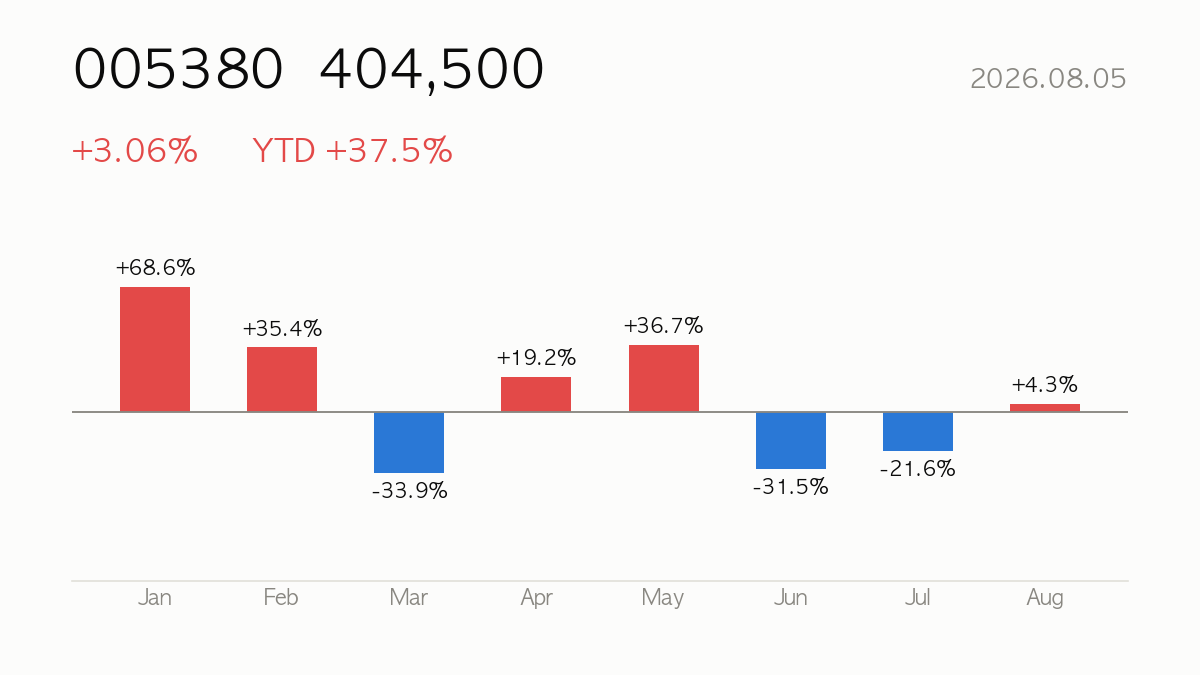
Hyundai Motor (005380) closed at ₩404,500, up 3.06% on the day. Year-to-date return is +37.5%, sitting at 34% of its 52-week range. Next earnings: 2026-10-29 (in 85 days). Listed in Seoul — for USD-based investors, KRW moves add an FX layer on top of the stock’s local return.
|
Close
₩404,500
+3.06% · YTD +37.5%
|
Market Cap
₩105.91T
Auto Manufacturers
|
Forward P/E
8.3x
PER 12.3x
|
52-wk Range
34%
High ₩783,000 · Low ₩208,500
|
🔍 At a Glance
Hyundai Motor trades at a rock-bottom forward PER of 8.3 and PBR of 0.9, with a “buy” consensus from 31 analysts averaging a target of ₩682,004 — well above the current ₩404,500, implying substantial re-rating potential if execution holds. Yet the stock is down 19.4% over one month and 27% over three months despite a +37.5% YTD gain, sitting only 34% up its 52-week range, so the bull case on cheap valuation and steady 1.9% revenue growth (₩188.71T TTM) must be weighed against a 5.5% operating margin and 7.2% ROE that remain thin for a global auto major, and against sharp recent price instability.
🏢 How It Makes Money
Hyundai’s core is the Vehicle segment — mass-market sedans, SUVs, and a fast-expanding EV/hybrid lineup (IONIQ, KONA Electric, TUCSON Hybrid) sold globally — supplemented by a Finance arm (auto loans, credit cards) and smaller businesses including rail manufacturing. As a KOSPI-listed chaebol flagship, its earnings are sensitive to global auto demand cycles, EV adoption pace, and the KRW/USD rate, which affects both export competitiveness and USD-based investor returns.
📈 Quarterly Results — Is Business Growing?
| Quarter | Revenue | Op. Income | Net Income | Op. Margin |
|---|---|---|---|---|
| 25Q1 | ₩44.41T | ₩3.63T | ₩3.16T | 8.2% |
| 25Q2 | ₩48.29T | ₩3.60T | ₩3.00T | 7.5% |
| 25Q3 | ₩46.72T | ₩2.54T | ₩2.26T | 5.4% |
| 25Q4 | ₩46.84T | ₩1.70T | ₩1.03T | 3.6% |
| 26Q1 | ₩45.94T | ₩2.51T | ₩2.34T | 5.5% |
| 26Q2* | ₩49.22T | ₩2.85T | ₩2.52T | 5.8% |
* 26Q2 figures come from the company’s preliminary earnings disclosure filed with Korea’s DART on 2026-07-23. They are unaudited and will be replaced once the reviewed quarterly or half-year report is filed.
Latest-quarter revenue up +1.9% versus the same quarter a year ago.

💡 Korea Market 101
⚖️ Valuation — Cheap or Expensive?
| Metric | Value | How to read it |
|---|---|---|
| P/E (trailing) | 12.3x | Price vs last 12 months’ earnings |
| P/E (forward) | 8.3x | Price vs next 12 months’ expected earnings — growth hopes baked in |
| P/S | 0.6x | Price vs revenue — for high-growth names with thin profits |
| P/B | 0.9x | Price vs book value — below 1x means priced under liquidation value |
| EV/EBITDA | 20.6x | Enterprise value (incl. debt) vs cash generation |
Peer comparison
| Name | Mkt Cap | P/E | Fwd P/E | P/S |
|---|---|---|---|---|
| HyundaiMtr | ₩105.91T | — | 8.3x | 0.6x |
| KIA CORP. | ₩51.69T | — | 5.6x | 0.4x |
| Toyota Motor Corporation | $224.00B | 9.9x | 12.0x | 0.0x |
| General Motors Company | $79.87B | 39.2x | 6.0x | 0.4x |
💡 Korea Market 101
💰 Dividend — What It Pays Back
- Dividend yield: 2.54%
- Dividend per share: ₩10,000
- 5-year average yield: 4.02% — below its historical average at the current price
- Payout ratio: 30.4%
💡 Korea Market 101
🎯 Street Consensus
- Price target (mean): ₩682,004
- Target high / low: ₩900,000 / ₩463,129
- Implied upside: +68.6%
- Rating: Buy (1.7/5)
- Analysts covering: 31
- Next earnings: 2026-10-29
💡 Korea Market 101
📉 Price Action — Technical Check

| Indicator | Value | How to read it |
|---|---|---|
| RSI (14d) | 42.9 | Above 70 overbought · below 30 oversold |
| vs 60-day MA | -25.6% | Above/below the medium-term trend |
| vs 200-day MA | -9.4% | Above/below the long-term trend |
| Golden/death cross | 50-day above 200-day (bullish alignment) | 50-day MA crossing above (golden) or below (death) the 200-day |
| Volume (vs 20d avg) | 0.6x | 2x+ means a spike in market attention |
💡 Korea Market 101
📰 Recent News
- Here’s What We Like About Hyundai Motor India’s (NSE:HYUNDAI) Upcoming Dividend — webull.com
- Hyundai Motor India stock jumps 7% after Q1; brokerages bullish, eye volume recovery for earnings growth — tradingview.com
- Purple Wave Secures ₹14.94 Crore Hyundai LOI; Shares Jump — HDFC Sky
- Why is Hyundai Motor stock crashing today? By Investing.com — Investing.com Nigeria
- Hyundai Motor No Longer Affordable as Stock Surges, Expert Warns — 조선일보
- Hyundai Motor shares rise 15% to hit record high amid Nvidia tie-up speculation — Yahoo Finance
How to read these headlines
Several headlines actually concern Hyundai Motor India, a separately listed subsidiary — worth confirming which entity is being discussed, since its dividend and earnings moves don’t directly translate to the Korea-listed parent. The more relevant Korea-specific headlines — a 15% surge on Nvidia tie-up speculation followed by a “crashing” headline and valuation warnings — illustrate the volatility embedded in recent price action, suggesting speculative flows around AI/tech partnership narratives are currently a bigger swing factor than fundamentals.
Headlines are credited to their publishers — click a headline to open the original article. The commentary is written by this site and does not represent the views of any publisher.
💡 Korea Market 101
🔭 Scenarios & What to Watch
With RSI at 42.9 and price 25.6% below its 60-day average but only 9.4% below its 200-day average, the stock looks technically oversold short-term but not in a structural downtrend. Watch the next earnings release on October 29, 2026, for confirmation of margin trends and volume recovery; sustained operating margins near or above 5.5% and any progress on EV cost structure could support the bullish target range (₩463,129–₩900,000), while further deceleration in revenue growth may weigh on sentiment.
Next earnings on 2026-10-29 (in 85 days) — guidance usually decides the stock’s direction more than the reported quarter.
💡 Korea Market 101
📚 All stock analysis · More on Hyundai Motor · Market report for this session
Stock report · published 2026-08-05 16:01 KST
For information only — a summary of public data, not a recommendation to buy or sell any security. Source data (Yahoo Finance and others) may be delayed or contain errors. All investment decisions are your own responsibility.
Leave a Reply