Stock Deep Dive · 2026-08-21
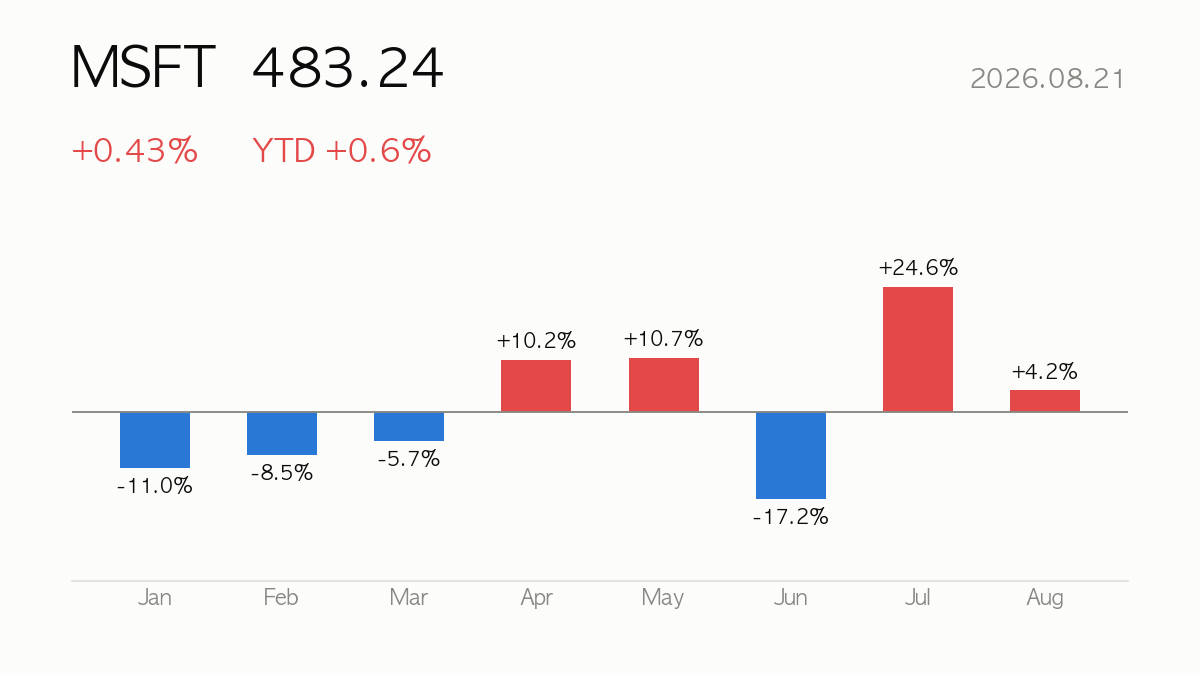
Microsoft (MSFT) closed at $483.24, up 0.43% on the day. Year-to-date return is +0.6%, sitting at 66% of its 52-week range. Next earnings: 2026-10-28 (in 67 days).
|
Close
$483.24
+0.43% · YTD +0.6%
|
Market Cap
$3,588.32B
Software – Infrastructure
|
Forward P/E
20.5x
PER 26.8x
|
52-wk Range
66%
High $553.72 · Low $349.20
|
🔍 At a Glance
Microsoft’s TTM revenue of $331.84B grew 17.7% YoY with a striking 46.8% operating margin and 34% ROE, underpinning a strong_buy consensus from 53 analysts averaging a $569.56 target (up from today’s 483.24). The bear case: forward PER of 20.5, PEG of 1.6 and EV/EBITDA of 18.7 leave little room for error, especially with massive AI capital spending pressuring free cash flow before returns are proven.
🏢 How It Makes Money
Microsoft monetizes a diversified stack spanning Productivity and Business Processes (Microsoft 365, Teams, LinkedIn, Copilot), cloud infrastructure, and devices/gaming. Enterprise subscriptions and cloud consumption drive recurring, high-margin revenue, while newer AI-infused products like Microsoft 365 Copilot represent the next leg of monetization layered onto an already dominant enterprise software franchise.
📈 Quarterly Results — Is Business Growing?
| Quarter | Revenue | Op. Income | Net Income | Op. Margin |
|---|---|---|---|---|
| 25Q2 | $76.44B | $34.32B | $27.23B | 44.9% |
| 25Q3 | $77.67B | $37.96B | $27.75B | 48.9% |
| 25Q4 | $81.27B | $38.27B | $38.46B | 47.1% |
| 26Q1 | $82.89B | $38.40B | $31.78B | 46.3% |
| 26Q2 | $90.01B | $40.60B | $35.77B | 45.1% |
Latest-quarter revenue up +17.7% versus the same quarter a year ago.

💡 Korea Market 101
⚖️ Valuation — Cheap or Expensive?
| Metric | Value | How to read it |
|---|---|---|
| P/E (trailing) | 26.8x | Price vs last 12 months’ earnings |
| P/E (forward) | 20.5x | Price vs next 12 months’ expected earnings — growth hopes baked in |
| P/S | 10.8x | Price vs revenue — for high-growth names with thin profits |
| P/B | 8.1x | Price vs book value — below 1x means priced under liquidation value |
| PEG | 1.6x | P/E ÷ growth — near 1 is fair for the growth; above 2 is demanding |
| EV/EBITDA | 18.7x | Enterprise value (incl. debt) vs cash generation |
Peer comparison
| Name | Mkt Cap | P/E | Fwd P/E | P/S |
|---|---|---|---|---|
| Microsoft Corporation | $3,588.32B | 26.9x | 20.5x | 10.8x |
| Alphabet Inc. | $4,217.13B | 17.3x | 23.3x | 9.5x |
| Amazon.com, Inc. | $2,789.66B | 20.8x | 24.9x | 3.6x |
| Oracle Corporation | $421.90B | 25.2x | 13.4x | 6.3x |
💡 Korea Market 101
🎯 Street Consensus
- Price target (mean): $569.56
- Target high / low: $870.00 / $400.00
- Implied upside: +17.9%
- Rating: Strong Buy (1.4/5)
- Analysts covering: 53
- Next earnings: 2026-10-28
💡 Korea Market 101
📉 Price Action — Technical Check

| Indicator | Value | How to read it |
|---|---|---|
| RSI (14d) | 47.6 | Above 70 overbought · below 30 oversold |
| vs 60-day MA | +15.0% | Above/below the medium-term trend |
| vs 200-day MA | +12.5% | Above/below the long-term trend |
| Golden/death cross | 50-day below 200-day (bearish alignment) | 50-day MA crossing above (golden) or below (death) the 200-day |
| Volume (vs 20d avg) | 0.6x | 2x+ means a spike in market attention |
💡 Korea Market 101
📰 Recent News
- Has Microsoft Stock Found The Next Growth Driver? — Forbes
- Is Microsoft a Screaming Buy Under $500 Per Share? — Currently.com
- Microsoft Spent $115.9 Billion on AI. What Did Shareholders Get? — 24/7 Wall St.
- Microsoft Stock (NASDAQ:MSFT) Notches Up With 22 New Security Patches — TipRanks
- Microsoft Corporation $MSFT Stock Position Boosted by Hamilton Wealth LLC — MarketBeat
- Is Microsoft a Screaming Buy Under $500 Per Share? — The Motley Fool
How to read these headlines
The common thread across headlines is investor scrutiny of whether Microsoft’s enormous AI capital outlay is translating into tangible growth, alongside routine analyst and ownership updates suggesting sustained institutional interest. The $115.9B AI spend question is the most consequential thread, since its payoff—via Azure and Copilot monetization—directly determines whether current premium valuation multiples (PEG 1.6, EV/EBITDA 18.7) are justified or vulnerable to reset if growth disappoints.
Headlines are credited to their publishers — click a headline to open the original article. The commentary is written by this site and does not represent the views of any publisher.
💡 Korea Market 101
🔭 Scenarios & What to Watch
Bull case: continued 15%+ revenue growth, expanding AI monetization (Copilot attach rates, Azure AI consumption), and margins holding near 47% could justify multiple expansion toward analyst highs of $870. Bear case: if the reported $115.9B in AI spending fails to show clear revenue payback, or margins compress, shares could retest lower support near MA60 (+15% cushion) or the $400 analyst floor. With RSI at 47.6 (neutral) and shares 12.5% above MA200, momentum is cooling after a strong run (+26.9% in one month). The next earnings report on 2026-10-28 will be the key checkpoint for AI ROI evidence and cloud growth trajectory.
Next earnings on 2026-10-28 (in 67 days) — guidance usually decides the stock’s direction more than the reported quarter.
💡 Korea Market 101
📚 All stock analysis · More on Microsoft · Market report for this session
Stock report · published 2026-08-22 07:26 KST
For information only — a summary of public data, not a recommendation to buy or sell any security. Source data (Yahoo Finance and others) may be delayed or contain errors. All investment decisions are your own responsibility.
Leave a Reply