Microsoft (MSFT) — Report Archive
Microsoft (MSFT) is listed on a US exchange. Stock Rollbar has published 3 reports on it (2026-07-24 ~ 2026-08-21). This page keeps what each report showed on its own reference date — valuation, latest-quarter results and analyst upside — side by side, together with every trade our trading system made in the stock.
AT A GLANCE
- As of the latest report (2026-08-21): close $483.24, YTD +0.6%, 66% of its 52-week range.
- Since the first report (2026-07-24) the stock has moved +26.6% across 3 reports; forward P/E went from 19.7x to 20.5x.
- Latest quarter (26Q2): revenue +17.7% YoY, operating margin 45.1%.
Report by report
| Report | Close | YTD | Fwd P/E | P/E | P/B | Rev YoY | Op. margin | Upside |
|---|---|---|---|---|---|---|---|---|
| 2026-08-21 | $483.24 | +0.6% | 20.5x | 26.8x | 8.1x | +17.7% 26Q2 | 45.1% | +17.9% |
| 2026-08-07 | $499.99 | +3.8% | 21.3x | 27.8x | 8.4x | +17.7% 26Q2 | 45.1% | +12.7% |
| 2026-07-24 | $381.70 | -20.7% | 19.7x | 22.6x | 8.3x | +18.3% 26Q1 | 46.3% | +45.9% |
Each row is what that report published on its reference date, not a live quote. Rev YoY and operating margin are for the latest quarter available then (* = preliminary). Upside = analysts’ mean target vs. that day’s close.
What the system did with this stock
The trading system has not traded this stock since season 1 began (2026-07-29). Trades appear here automatically when it does.
-
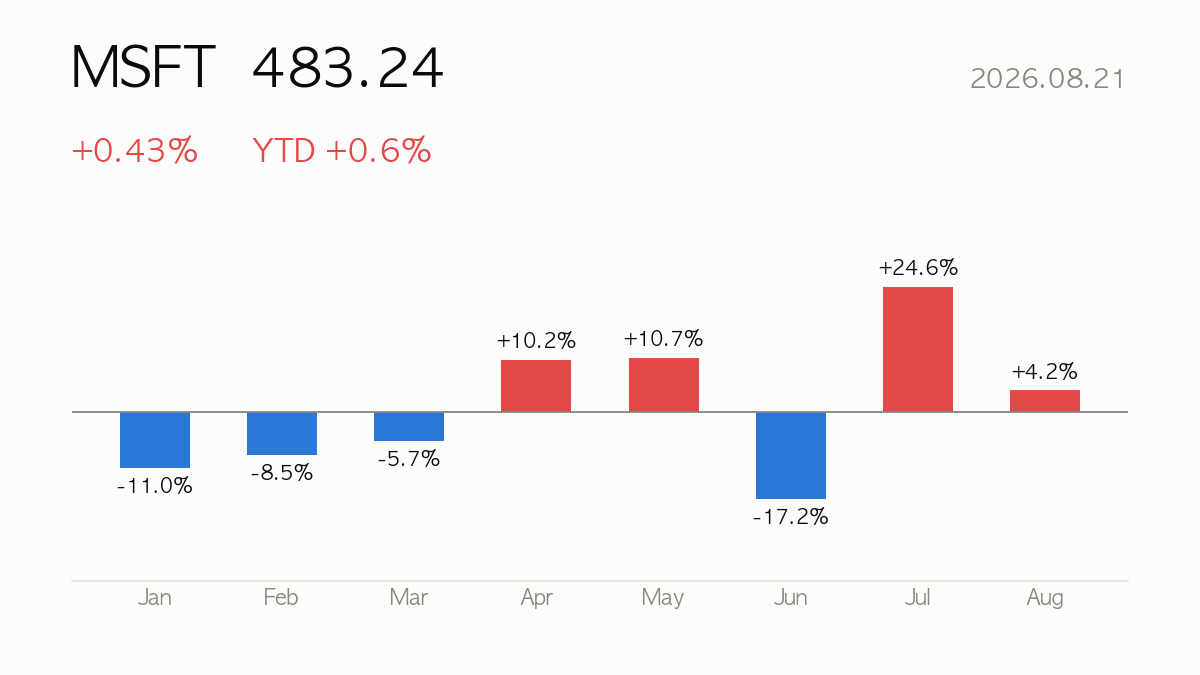
[Deep Dive] 2026.08.21 Microsoft (MSFT) +1% YTD — Fundamentals, Valuation & Outlook
Microsoft (MSFT) closed at $483.24, up 0.43% on the day. Year-to-date return is +0.6%, sitting at 66% of its 52-week range. Next…
-

[Deep Dive] 2026.08.07 Microsoft (MSFT) +4% YTD — Fundamentals, Valuation & Outlook
Microsoft (MSFT) closed at $499.99, up 0.03% on the day. Year-to-date return is +3.8%, sitting at 74% of its 52-week range. Earnings…
-
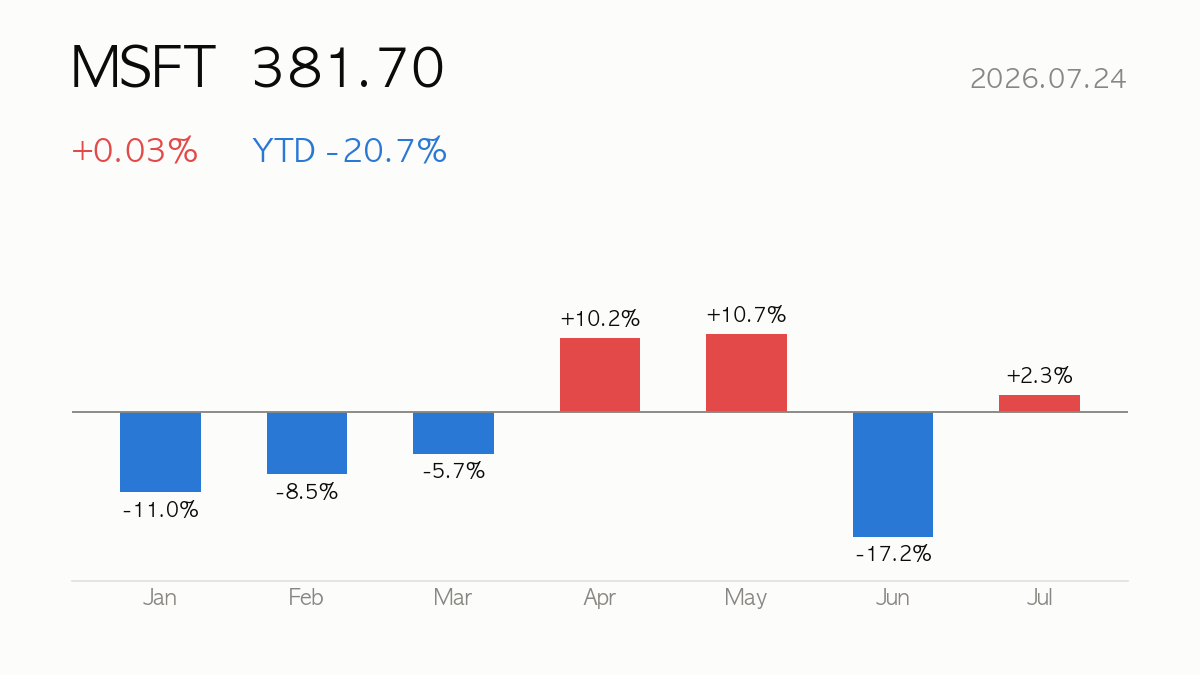
[Deep Dive] 2026.07.24 Microsoft (MSFT) -21% YTD — Fundamentals, Valuation & Outlook
Microsoft (MSFT) closed at $381.70, up 0.03% on the day. Year-to-date return is -20.7%, sitting at 16% of its 52-week range. Next…