Stock Deep Dive · 2026-08-12
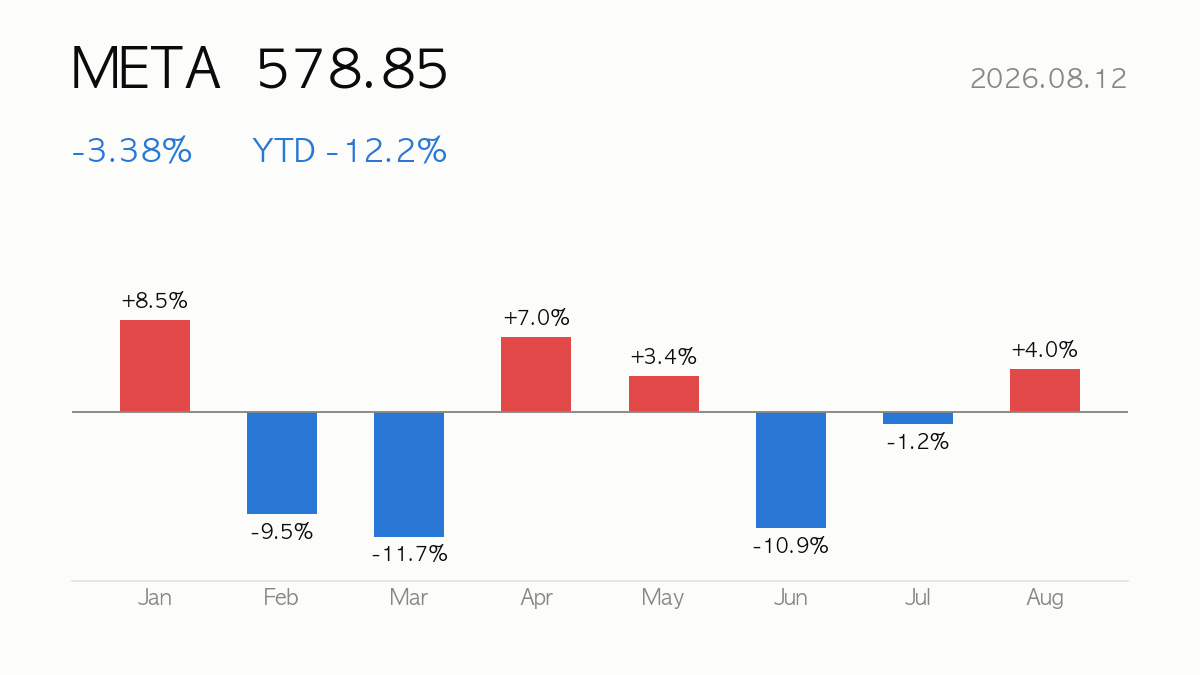
Meta Platforms (META) closed at $578.85, down 3.38% on the day. Year-to-date return is -12.2%, sitting at 21% of its 52-week range. Next earnings: 2026-10-28 (in 76 days).
|
Close
$578.85
-3.38% · YTD -12.2%
|
Market Cap
$1,474.62B
Internet Content & Information
|
Forward P/E
16.6x
PER 21.7x
|
52-wk Range
21%
High $796.25 · Low $520.26
|
🔍 At a Glance
Meta’s core ad business keeps humming — TTM revenue of $228.25B with quarterly growth of +28.0% YoY and a striking 38.1% operating margin, backing a 29.8% ROE and a PEG near 0.9 that suggests earnings growth still outruns the forward multiple of 16.6x. Yet the stock is down -12.2% YTD, sits just 21% up its 52-week range, and trades below both its 60- and 200-day moving averages, reflecting investor unease over AI spending, legal overhang, and Reality Labs losses that could dilute this profitability story.
🏢 How It Makes Money
Meta monetizes attention across Facebook, Instagram, Messenger and Threads primarily through advertising, layering in Meta AI and AI glasses as newer engagement and monetization vectors. Reality Labs remains the investment-heavy, loss-generating segment betting on VR/AI hardware, while the Family of Apps segment continues to fund the enterprise with high-margin ad dollars.
📈 Quarterly Results — Is Business Growing?
| Quarter | Revenue | Op. Income | Net Income | Op. Margin |
|---|---|---|---|---|
| 25Q2 | $47.52B | $20.44B | $18.34B | 43.0% |
| 25Q3 | $51.24B | $20.54B | $2.71B | 40.1% |
| 25Q4 | $59.89B | $24.75B | $22.77B | 41.3% |
| 26Q1 | $56.31B | $22.87B | $26.77B | 40.6% |
| 26Q2 | $60.80B | $18.77B | $15.85B | 30.9% |
Latest-quarter revenue up +28.0% versus the same quarter a year ago.

💡 Korea Market 101
⚖️ Valuation — Cheap or Expensive?
| Metric | Value | How to read it |
|---|---|---|
| P/E (trailing) | 21.7x | Price vs last 12 months’ earnings |
| P/E (forward) | 16.6x | Price vs next 12 months’ expected earnings — growth hopes baked in |
| P/S | 6.5x | Price vs revenue — for high-growth names with thin profits |
| P/B | 6.8x | Price vs book value — below 1x means priced under liquidation value |
| PEG | 0.9x | P/E ÷ growth — near 1 is fair for the growth; above 2 is demanding |
| EV/EBITDA | 14.1x | Enterprise value (incl. debt) vs cash generation |
Peer comparison
| Name | Mkt Cap | P/E | Fwd P/E | P/S |
|---|---|---|---|---|
| Meta Platforms, Inc. | $1,474.62B | 21.8x | 16.6x | 6.5x |
| Alphabet Inc. | $4,201.47B | 17.2x | 23.3x | 9.4x |
| Snap Inc. | $8.79B | — | 6.7x | 1.4x |
| Pinterest, Inc. | $12.97B | 67.4x | 9.5x | 2.8x |
💡 Korea Market 101
🎯 Street Consensus
- Price target (mean): $754.14
- Target high / low: $1,000.00 / $580.00
- Implied upside: +30.3%
- Rating: Strong Buy (1.4/5)
- Analysts covering: 57
- Next earnings: 2026-10-28
💡 Korea Market 101
📉 Price Action — Technical Check

| Indicator | Value | How to read it |
|---|---|---|
| RSI (14d) | 41.0 | Above 70 overbought · below 30 oversold |
| vs 60-day MA | -3.6% | Above/below the medium-term trend |
| vs 200-day MA | -7.9% | Above/below the long-term trend |
| Golden/death cross | 50-day below 200-day (bearish alignment) | 50-day MA crossing above (golden) or below (death) the 200-day |
| Volume (vs 20d avg) | 0.9x | 2x+ means a spike in market attention |
💡 Korea Market 101
📰 Recent News
- Alphabet, Amazon, Meta Platforms, and Microsoft: One of These Stocks Looks Like It Has the Least Upside Over the Next 12 Months, but There’s a Catch — Yahoo Finance
- What’s Going On with the Drop in Meta Stock? — Benzinga
- Meta Stock Drops While $1.4 Trillion Trial Opens — TradingView
- Meta Platforms: The Most Disrespected Name In Big Tech (NASDAQ:META) — Seeking Alpha
- Meta Stock Climbs On Open-Source Model Launch; Zuckerberg Criticizes AI Rivals — Investor’s Business Daily
- Meta Stock Resumes Downtrend Toward $500 as Glasses Complaint and China Block Weigh — FXLeaders
How to read these headlines
The common thread is intensifying scrutiny of Meta’s AI spending and legal/regulatory exposure just as it tries to prove AI monetization via open-source model launches and Meta AI rollout. A $1.4 trillion trial and a China-related complaint add headline-driven volatility that can pressure sentiment and multiples even as fundamentals stay strong, making it worth confirming whether these are one-off legal costs or signals of deeper margin risk from AI capex.
Headlines are credited to their publishers — click a headline to open the original article. The commentary is written by this site and does not represent the views of any publisher.
💡 Korea Market 101
🔭 Scenarios & What to Watch
Bulls will watch for stabilization above the 52-week lows and a re-test of MA60/MA200 resistance, alongside continued ad-revenue momentum ahead of the next earnings report on 2026-10-28. Bears will focus on legal/regulatory headline risk, Reality Labs cash burn, and whether RSI near 41 signals further downside toward the analyst low target of 580.00 — a level already breached intraday. The wide consensus range (580–1,000, average 754.14) underscores how differently the market could interpret the next few catalysts.
Next earnings on 2026-10-28 (in 76 days) — guidance usually decides the stock’s direction more than the reported quarter.
💡 Korea Market 101
📚 All stock analysis · More on Meta Platforms · Market report for this session
Stock report · published 2026-08-13 07:26 KST
For information only — a summary of public data, not a recommendation to buy or sell any security. Source data (Yahoo Finance and others) may be delayed or contain errors. All investment decisions are your own responsibility.
Leave a Reply