Stock Deep Dive · 2026-08-25
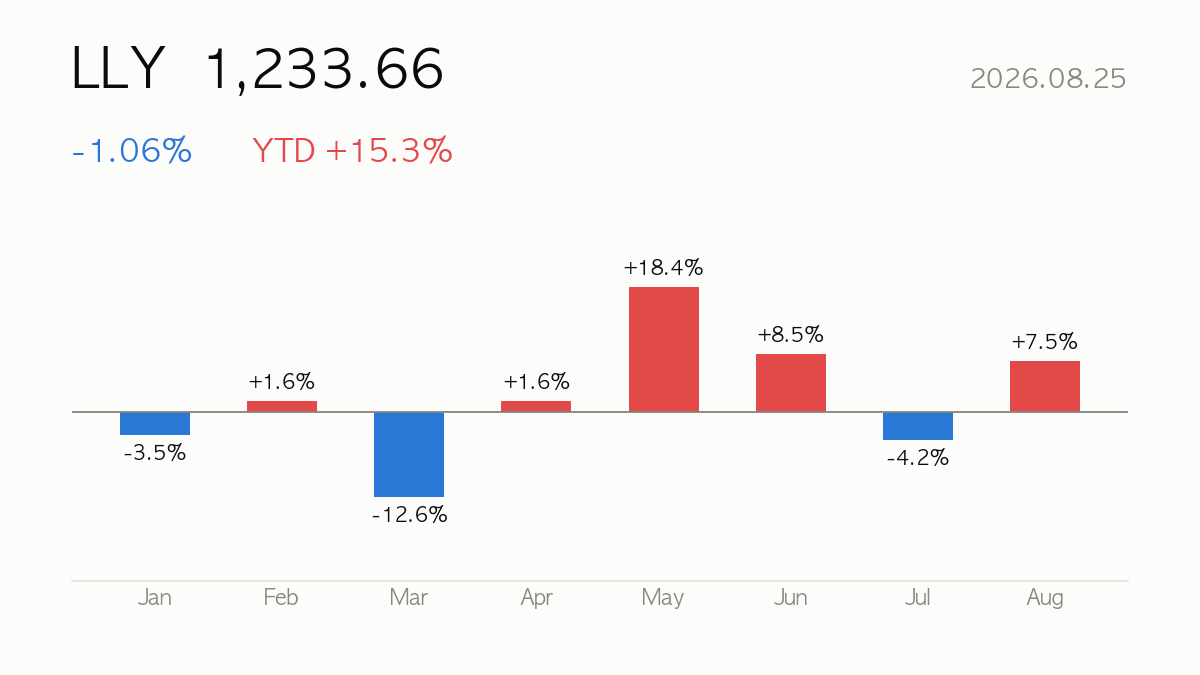
Eli Lilly (LLY) closed at $1,233.66, down 1.06% on the day. Year-to-date return is +15.3%, sitting at 90% of its 52-week range. Next earnings: 2026-10-29 (in 64 days).
|
Close
$1,233.66
-1.06% · YTD +15.3%
|
Market Cap
$1,100.11B
Drug Manufacturers – General
|
Forward P/E
26.1x
PER 41.2x
|
52-wk Range
90%
High $1,292.65 · Low $712.05
|
🔍 At a Glance
Eli Lilly is compounding at a pace few large-caps can match — 47.7% quarterly revenue growth, a 49.7% operating margin, and an eye-popping 102.3% ROE point to a business firing on all cylinders behind Mounjaro and Zepbound. The bear case sits in the price you pay for that quality: a trailing PER of 41.2, PBR of 41.5, and a stock sitting at 90% of its 52-week range, leaving little room for execution missteps.
🏢 How It Makes Money
Lilly’s growth engine is its cardiometabolic franchise — Mounjaro and Zepbound for diabetes and obesity — layered atop legacy insulins (Humalog, Humulin, Basaglar) and a diversified oncology portfolio (Cyramza, Erbitux, Jaypirca, Retevmo). The obesity/GLP-1 category is doing the heavy lifting on the top line, while established diabetes and cancer drugs provide a steadier cash-flow base.
📈 Quarterly Results — Is Business Growing?
| Quarter | Revenue | Op. Income | Net Income | Op. Margin |
|---|---|---|---|---|
| 25Q2 | $15.56B | $7.02B | $5.66B | 45.1% |
| 25Q3 | $17.60B | $8.39B | $5.58B | 47.6% |
| 25Q4 | $19.29B | $8.99B | $6.64B | 46.6% |
| 26Q1 | $19.80B | $9.78B | $7.40B | 49.4% |
| 26Q2 | $22.97B | $12.46B | $7.09B | 54.2% |
Latest-quarter revenue up +47.7% versus the same quarter a year ago.

💡 Korea Market 101
⚖️ Valuation — Cheap or Expensive?
| Metric | Value | How to read it |
|---|---|---|
| P/E (trailing) | 41.2x | Price vs last 12 months’ earnings |
| P/E (forward) | 26.1x | Price vs next 12 months’ expected earnings — growth hopes baked in |
| P/S | 13.8x | Price vs revenue — for high-growth names with thin profits |
| P/B | 41.5x | Price vs book value — below 1x means priced under liquidation value |
| PEG | 1.6x | P/E ÷ growth — near 1 is fair for the growth; above 2 is demanding |
| EV/EBITDA | 27.8x | Enterprise value (incl. debt) vs cash generation |
Peer comparison
| Name | Mkt Cap | P/E | Fwd P/E | P/S |
|---|---|---|---|---|
| Eli Lilly and Company | $1,100.11B | 41.4x | 26.1x | 13.8x |
| Novo Nordisk A/S | $215.18B | 11.9x | 14.2x | 0.7x |
| Merck & Company, Inc. | $385.99B | 125.2x | 16.4x | 5.8x |
| Pfizer, Inc. | $162.84B | 37.6x | 9.9x | 2.6x |
💡 Korea Market 101
🎯 Street Consensus
- Price target (mean): $1,315.04
- Target high / low: $1,600.00 / $850.00
- Implied upside: +6.6%
- Rating: Buy (1.7/5)
- Analysts covering: 29
- Next earnings: 2026-10-29
💡 Korea Market 101
📉 Price Action — Technical Check

| Indicator | Value | How to read it |
|---|---|---|
| RSI (14d) | 60.8 | Above 70 overbought · below 30 oversold |
| vs 60-day MA | +5.3% | Above/below the medium-term trend |
| vs 200-day MA | +17.2% | Above/below the long-term trend |
| Golden/death cross | 50-day above 200-day (bullish alignment) | 50-day MA crossing above (golden) or below (death) the 200-day |
| Volume (vs 20d avg) | 0.8x | 2x+ means a spike in market attention |
💡 Korea Market 101
📰 Recent News
- Eli Lilly Found a New Gear. You Paid For It. — Trefis
- Stock Split Watch: Is Eli Lilly (LLY) Stock Next? — Yahoo Finance
- LLY Stock Rides Trump Spotlight: President Touts Eli Lilly’s $3.5B Factory As Weight-Loss Pill Plans Go Global — Stocktwits
- Eli Lilly & Co. stock underperforms Tuesday when compared to competitors — MarketWatch
- Why Eli Lilly (LLY) Stock Is Up Today — StockStory
- Why is Eli Lilly stock slipping today? — Investing.com
How to read these headlines
The headlines swing between celebration — a split-watch narrative, presidential attention on a $3.5B manufacturing investment, and “found a new gear” commentary — and short-term wobbles, with the stock underperforming peers and slipping on some days. The common thread is that Lilly has become a bellwether for the obesity-drug supercycle, so political attention, manufacturing capacity, and global expansion of weight-loss therapies all feed directly into revenue expectations. Day-to-day stock moves look more like noise around a high-conviction growth story than a change in fundamentals, though the split chatter is worth confirming as it carries no earnings implication.
Headlines are credited to their publishers — click a headline to open the original article. The commentary is written by this site and does not represent the views of any publisher.
💡 Korea Market 101
🔭 Scenarios & What to Watch
Shares trade well above both the 60-day and 200-day moving averages (+5.3% and +17.2%, respectively) with RSI at 60.8 — momentum is intact but not yet overheated. The next earnings release on 2026-10-29 will be the key checkpoint for whether the 47.7% revenue growth pace can hold; any deceleration in Zepbound/Mounjaro demand, manufacturing capacity news, or pricing pressure could test the premium valuation (forward PER still 26.1). Analyst targets (average 1,315, range 850–1,600) suggest modest further upside is priced in by consensus, but the wide range underscores disagreement on durability.
Next earnings on 2026-10-29 (in 64 days) — guidance usually decides the stock’s direction more than the reported quarter.
💡 Korea Market 101
📚 All stock analysis · More on Eli Lilly · Market report for this session
Stock report · published 2026-08-26 07:26 KST
For information only — a summary of public data, not a recommendation to buy or sell any security. Source data (Yahoo Finance and others) may be delayed or contain errors. All investment decisions are your own responsibility.
Leave a Reply