Stock Deep Dive · 2026-07-31
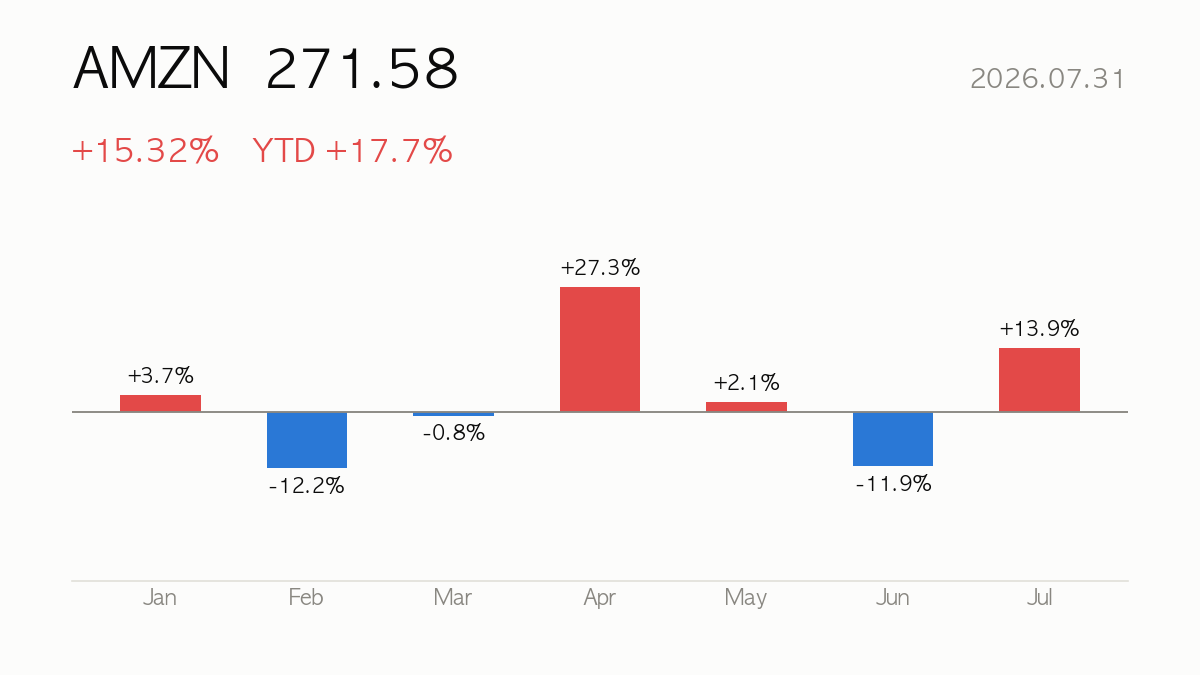
Amazon (AMZN) closed at $271.58, up 15.32% on the day. Year-to-date return is +17.7%, sitting at 92% of its 52-week range. Earnings for the quarter were reported on 2026-07-30 (EPS $5.75 vs $1.83 consensus, +214%).
|
Close
$271.58
+15.32% · YTD +17.7%
|
Market Cap
$2,921.42B
Internet Retail
|
Forward P/E
26.7x
PER 32.2x
|
52-wk Range
92%
High $278.56 · Low $196.00
|
🔍 At a Glance
Amazon just posted a “home run” quarter, with AWS reaccelerating and quarterly revenue growth of +16.6% YoY, sending shares up 15.32% in a day to 271.58 and near the top of their 52-week range (92%). Bulls point to expanding operating margins (11.5% TTM), 30.6% ROE, and strong_buy consensus from 61 analysts; bears will note the stock now trades at 32.2x earnings and 15.6x EV/EBITDA, already pricing in much of the good news, with RSI at 64 and shares 15.6% above the 200-day average.
🏢 How It Makes Money
Amazon runs three core segments — North America and International retail, plus AWS — supplemented by advertising, third-party seller services, subscriptions (Prime), device sales, and content production. AWS remains the profit engine given its cloud infrastructure, AI, and data services, while retail and advertising provide scale and cash flow, together underpinning the 11.5% operating margin on $775.68B TTM revenue.
📈 Quarterly Results — Is Business Growing?
| Quarter | Revenue | Op. Income | Net Income | Op. Margin |
|---|---|---|---|---|
| 25Q1 | $155.67B | $18.41B | $17.13B | 11.8% |
| 25Q2 | $167.70B | $19.17B | $18.16B | 11.4% |
| 25Q3 | $180.17B | $17.42B | $21.19B | 9.7% |
| 25Q4 | $213.39B | $24.98B | $21.19B | 11.7% |
| 26Q1 | $181.52B | $23.85B | $30.25B | 13.1% |
Latest-quarter revenue up +16.6% versus the same quarter a year ago.

💡 Korea Market 101
⚖️ Valuation — Cheap or Expensive?
| Metric | Value | How to read it |
|---|---|---|
| P/E (trailing) | 32.2x | Price vs last 12 months’ earnings |
| P/E (forward) | 26.7x | Price vs next 12 months’ expected earnings — growth hopes baked in |
| P/S | 3.9x | Price vs revenue — for high-growth names with thin profits |
| P/B | 7.1x | Price vs book value — below 1x means priced under liquidation value |
| PEG | 1.3x | P/E ÷ growth — near 1 is fair for the growth; above 2 is demanding |
| EV/EBITDA | 15.6x | Enterprise value (incl. debt) vs cash generation |
Peer comparison
| Name | Mkt Cap | P/E | Fwd P/E | P/S |
|---|---|---|---|---|
| Amazon.com, Inc. | $2,921.42B | 21.8x | 26.7x | 3.8x |
| Microsoft Corporation | $3,450.80B | 25.9x | 20.0x | 10.4x |
| Alphabet Inc. | $4,355.45B | 17.9x | 24.2x | 9.8x |
| Walmart Inc. | $884.94B | 39.2x | 33.9x | 1.2x |
💡 Korea Market 101
🎯 Street Consensus
- Price target (mean): $313.07
- Target high / low: $370.00 / $207.00
- Implied upside: +15.3%
- Rating: Strong Buy (1.3/5)
- Analysts covering: 61
- Last earnings: 2026-07-30 — reported
💡 Korea Market 101
📉 Price Action — Technical Check

| Indicator | Value | How to read it |
|---|---|---|
| RSI (14d) | 64.0 | Above 70 overbought · below 30 oversold |
| vs 60-day MA | +8.6% | Above/below the medium-term trend |
| vs 200-day MA | +15.6% | Above/below the long-term trend |
| Golden/death cross | 50-day above 200-day (bullish alignment) | 50-day MA crossing above (golden) or below (death) the 200-day |
| Volume (vs 20d avg) | 2.8x | 2x+ means a spike in market attention |
💡 Korea Market 101
📰 Recent News
- Amazon stock soars as e-commerce giant’s AWS cloud business booms in ‘home run’ quarter — Yahoo Finance
- Alphabet, Amazon and Microsoft added nearly $1.5 trillion in combined value this week — CNBC
- Stock Market Today: Dow, Nasdaq End Higher Despite Spiking Yields; Amazon Soars — Investor’s Business Daily
- Stock Market News July 31: Dow, S&P 500 and Nasdaq finish higher, capping off volatile month in the green; Nasdaq sees biggest monthly drop since March — MarketWatch
- Nvidia Is Back on Top as Most Valuable Company After Apple Stumbles — Barron’s
- Stocks making the biggest moves after hours: Apple, Amazon, Rivian, Reddit & more — CNBC
How to read these headlines
The common thread across the headlines is a broad mega-cap rally, with Amazon, Alphabet, and Microsoft together adding nearly $1.5 trillion in value in a single week, driven largely by AWS’s cloud strength. This matters for Amazon’s valuation because it signals investors are rewarding cloud/AI momentum with premium multiples, though rotation risk exists, as seen in Nvidia reclaiming the top market-cap spot from Apple — a reminder that leadership among mega-caps can shift quickly.
Headlines are credited to their publishers — click a headline to open the original article. The commentary is written by this site and does not represent the views of any publisher.
💡 Korea Market 101
🔭 Scenarios & What to Watch
The next earnings report on 2026-10-29 will be the key test of whether AWS’s momentum and margin trends persist. Watch whether forward PER (26.7) and PEG (1.3) hold up if growth decelerates from current levels, and whether the stock can sustain trading near its 52-week high without a pullback given RSI above 60. Analyst targets range widely (207 to 370), reflecting real uncertainty about how much further upside is priced in versus already captured.
💡 Korea Market 101
📚 All stock analysis · More on Amazon · Market report for this session
Stock report · published 2026-08-01 07:25 KST
For information only — a summary of public data, not a recommendation to buy or sell any security. Source data (Yahoo Finance and others) may be delayed or contain errors. All investment decisions are your own responsibility.
Leave a Reply