Stock Deep Dive · 2026-08-06
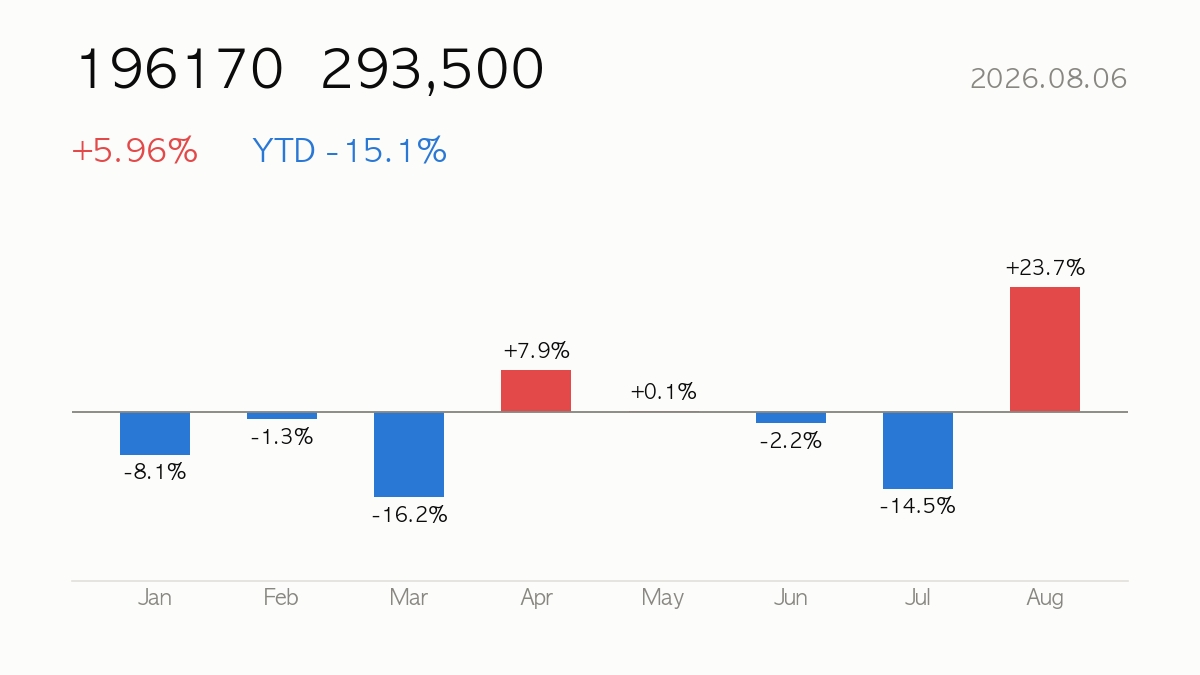
Alteogen (196170) closed at ₩293,500, up 5.96% on the day. Year-to-date return is -15.1%, sitting at 41% of its 52-week range. Listed in Seoul — for USD-based investors, KRW moves add an FX layer on top of the stock’s local return.
|
Close
₩293,500
+5.96% · YTD -15.1%
|
Market Cap
₩20.42T
Biotechnology
|
Forward P/E
50.8x
PER 156.8x
|
52-wk Range
41%
High ₩569,000 · Low ₩253,000
|
🔍 At a Glance
Alteogen is Korea’s hottest biotech story right now, riding its proprietary hyaluronidase (NexP/ALT-B4) platform for subcutaneous drug formulations into a string of licensing deals — the latest reportedly worth up to $365 million, part of a pattern of blockbuster partnerships (Biogen among the counterparties) that keeps analysts firmly bullish, with all 6 covering the stock at “buy” and an average target of ₩351,282, well above the current ₩293,500. The bear case is just as loud: at 156.8x trailing earnings, 50.8x forward earnings, and nearly 46x book value, the stock already prices in years of licensing success, while the latest quarter’s revenue actually fell 14.5% YoY, and RSI above 75 flags a stock that has run hot fast.
🏢 How It Makes Money
Alteogen’s core earnings engine is not drug sales but licensing and milestone payments for its NexP hyaluronidase platform, which converts IV biologics into subcutaneous formulations, plus NexMab ADC and biosimilar programs (including an Eylea biosimilar partnership with Kissei). This licensing model explains the unusually high 41.8% TTM operating margin and 25.2% ROE despite a relatively small ₩203.8B TTM revenue base — profitability swings heavily on deal timing rather than steady product sales.
📈 Quarterly Results — Is Business Growing?
| Quarter | Revenue | Op. Income | Net Income | Op. Margin |
|---|---|---|---|---|
| 25Q1 | ₩83.7B | ₩61.0B | ₩83.2B | 72.9% |
| 25Q2 | ₩18.6B | ₩-0.4B | ₩-33.1B | -2.3% |
| 25Q3 | ₩49.0B | ₩26.7B | ₩22.3B | 54.4% |
| 25Q4 | ₩64.5B | ₩19.6B | ₩69.2B | 30.4% |
| 26Q1 | ₩71.6B | ₩39.3B | ₩71.7B | 54.9% |
Latest-quarter revenue down -14.5% versus the same quarter a year ago.

💡 Korea Market 101
⚖️ Valuation — Cheap or Expensive?
| Metric | Value | How to read it |
|---|---|---|
| P/E (trailing) | 156.8x | Price vs last 12 months’ earnings |
| P/E (forward) | 50.8x | Price vs next 12 months’ expected earnings — growth hopes baked in |
| P/S | 100.2x | Price vs revenue — for high-growth names with thin profits |
| P/B | 45.9x | Price vs book value — below 1x means priced under liquidation value |
| EV/EBITDA | 179.2x | Enterprise value (incl. debt) vs cash generation |
Peer comparison
| Name | Mkt Cap | P/E | Fwd P/E | P/S |
|---|---|---|---|---|
| Alteogen | ₩20.42T | — | 50.8x | 100.2x |
| Celltrion | ₩44.72T | — | 25.8x | 10.0x |
| SAMSUNG BIOLOGICS | ₩70.08T | — | 30.8x | 14.6x |
💡 Korea Market 101
🎯 Street Consensus
- Price target (mean): ₩351,282
- Target high / low: ₩476,923 / ₩192,308
- Implied upside: +19.7%
- Rating: Buy (2.0/5)
- Analysts covering: 6
💡 Korea Market 101
📉 Price Action — Technical Check

| Indicator | Value | How to read it |
|---|---|---|
| RSI (14d) | 75.5 | Above 70 overbought · below 30 oversold |
| vs 60-day MA | +13.4% | Above/below the medium-term trend |
| vs 200-day MA | -4.6% | Above/below the long-term trend |
| Golden/death cross | 50-day below 200-day (bearish alignment) | 50-day MA crossing above (golden) or below (death) the 200-day |
| Volume (vs 20d avg) | 1.3x | 2x+ means a spike in market attention |
💡 Korea Market 101
📰 Recent News
- Price to book forward of ALTEOGEN Inc. – KRX:196170 — TradingView
- Alteogen signs licensing deal worth up to $365 million By Investing.com — Investing.com Canada
- KOSDAQ Briefly Reclaims 800 as Alteogen Jumps 4% on 520 Billion Won Deal — Seoul Economic Daily
- [JPM 2026] Alteogen nears another massive deal: CEO — The Korea Herald
- Biogen Stock (BIIB) Opinions on Alteogen Partnership — Quiver Quantitative
- Korea roundup: Alteogen, Celltrion lead biotech deals — bioworld.com
How to read these headlines
The common thread is deal-flow momentum: successive licensing announcements (Biogen, the $365 million deal, KOSDAQ index impact) are driving sentiment and price more than underlying product revenue. This matters because Alteogen’s valuation already assumes continued deal success — any pause in new agreements or delay in milestone payments could quickly expose the gap between rich multiples and lumpy, deal-dependent cash flow.
Headlines are credited to their publishers — click a headline to open the original article. The commentary is written by this site and does not represent the views of any publisher.
💡 Korea Market 101
🔭 Scenarios & What to Watch
Bulls need confirmation that the newly signed and rumored deals (the CEO has flagged another “massive” one) convert into recognized milestone revenue, reversing the recent quarterly sales decline. Bears will watch whether the stock, now 41% into its 52-week range but trading 13.4% above its 60-day average, cools off toward the ₩192,307 analyst low if no near-term catalyst materializes. Watch upcoming clinical trial readouts (ALT-P7, ALT-Q5) and the next earnings release for revenue recognition detail.
💡 Korea Market 101
📚 All stock analysis · More on Alteogen · Market report for this session
Stock report · published 2026-08-06 16:00 KST
For information only — a summary of public data, not a recommendation to buy or sell any security. Source data (Yahoo Finance and others) may be delayed or contain errors. All investment decisions are your own responsibility.
Leave a Reply