Stock Deep Dive · 2026-08-12
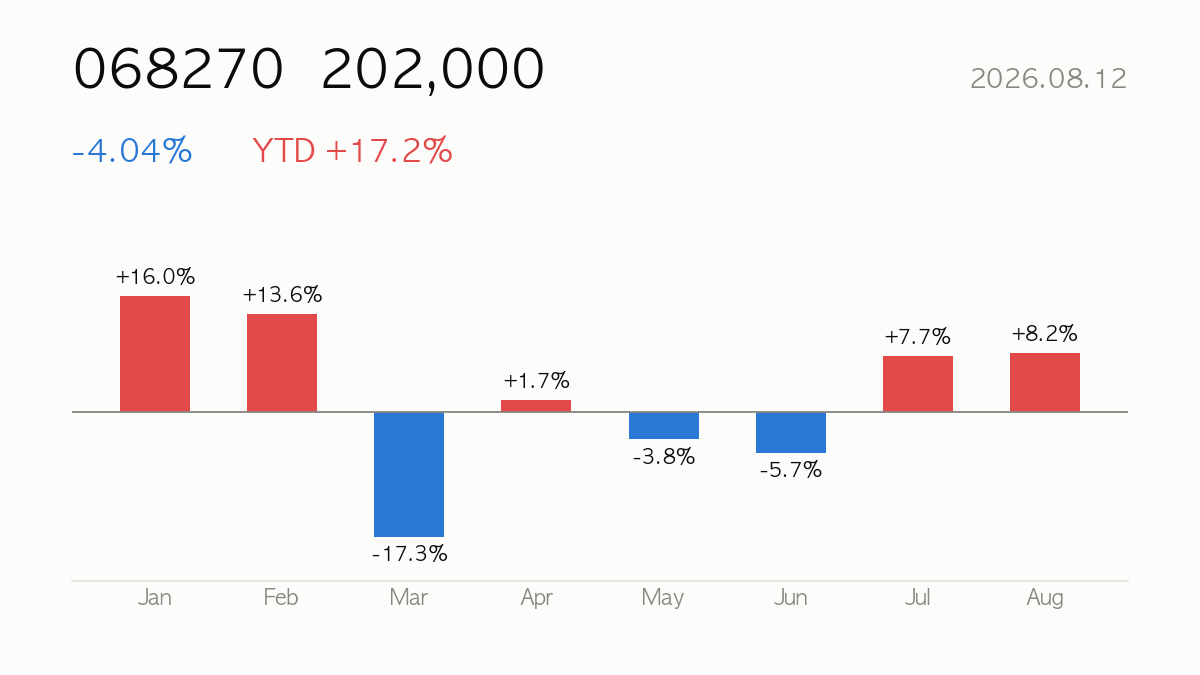
Celltrion (068270) closed at ₩202,000, down 4.04% on the day. Year-to-date return is +17.2%, sitting at 54% of its 52-week range. Earnings for the quarter were reported on 2026-08-06. Listed in Seoul — for USD-based investors, KRW moves add an FX layer on top of the stock’s local return.
|
Close
₩202,000
-4.04% · YTD +17.2%
|
Market Cap
₩46.32T
Biotechnology
|
Forward P/E
26.7x
PER 36.6x
|
52-wk Range
54%
High ₩239,048 · Low ₩158,500
|
🔍 At a Glance
Celltrion just posted a record quarter, with revenue up 45% YoY and a healthy 29.8% operating margin, backed by an expanding biosimilar portfolio (Remsima, Truxima, Yuflyma, Steqeyma and more) that gives it rare scale among Korean biopharma names. But the stock trades at a rich 36.6x trailing PER and 31.2x EV/EBITDA versus a modest 7.3% ROE, and RSI near 73 with shares 13% above the 60-day average signals it may be overbought after a 15% one-month run.
🏢 How It Makes Money
Celltrion generates most of its ₩4.47T TTM revenue from a broad biosimilar lineup spanning autoimmune, oncology, and ophthalmology indications, competing on price and manufacturing scale against originator biologics globally. Newer launches like Steqeyma, Avtozma, and Omlyclo extend the pipeline beyond legacy products like Remsima and Truxima, supporting the strong quarterly top-line growth.
📈 Quarterly Results — Is Business Growing?
| Quarter | Revenue | Op. Income | Net Income | Op. Margin |
|---|---|---|---|---|
| 25Q1 | ₩841.9B | ₩149.4B | ₩108.7B | 17.7% |
| 25Q2 | ₩961.5B | ₩229.9B | ₩61.2B | 23.9% |
| 25Q3 | ₩1.03T | ₩301.4B | ₩331.4B | 29.3% |
| 25Q4 | ₩1.33T | ₩475.8B | ₩528.4B | 35.8% |
| 26Q1 | ₩1.14T | ₩321.9B | ₩346.1B | 28.1% |
| 26Q2* | ₩1.39T | ₩451.8B | ₩370.2B | 32.4% |
* 26Q2 figures come from the company’s preliminary earnings disclosure filed with Korea’s DART on 2026-07-27. They are unaudited and will be replaced once the reviewed quarterly or half-year report is filed.
Latest-quarter revenue up +45.0% versus the same quarter a year ago.

💡 Korea Market 101
⚖️ Valuation — Cheap or Expensive?
| Metric | Value | How to read it |
|---|---|---|
| P/E (trailing) | 36.6x | Price vs last 12 months’ earnings |
| P/E (forward) | 26.7x | Price vs next 12 months’ expected earnings — growth hopes baked in |
| P/S | 10.4x | Price vs revenue — for high-growth names with thin profits |
| P/B | 2.7x | Price vs book value — below 1x means priced under liquidation value |
| EV/EBITDA | 31.2x | Enterprise value (incl. debt) vs cash generation |
Peer comparison
| Name | Mkt Cap | P/E | Fwd P/E | P/S |
|---|---|---|---|---|
| Celltrion | ₩46.32T | — | 26.7x | 10.4x |
| SAMSUNG BIOLOGICS | ₩71.70T | — | 31.5x | 14.9x |
| Alteogen | ₩22.09T | — | 52.3x | 108.4x |
💡 Korea Market 101
🎯 Street Consensus
- Price target (mean): ₩264,709
- Target high / low: ₩330,000 / ₩200,000
- Implied upside: +31.0%
- Rating: Buy (1.5/5)
- Analysts covering: 24
- Last earnings: 2026-08-06 — reported
💡 Korea Market 101
📉 Price Action — Technical Check

| Indicator | Value | How to read it |
|---|---|---|
| RSI (14d) | 72.9 | Above 70 overbought · below 30 oversold |
| vs 60-day MA | +13.4% | Above/below the medium-term trend |
| vs 200-day MA | +8.3% | Above/below the long-term trend |
| Golden/death cross | 50-day below 200-day (bearish alignment) | 50-day MA crossing above (golden) or below (death) the 200-day |
| Volume (vs 20d avg) | 1.2x | 2x+ means a spike in market attention |
💡 Korea Market 101
📰 Recent News
- Celltrion’s record quarter sparks target-price upgrades — The Korea Herald
- Celltrion Completes 100 Billion Won Treasury Share Retirement — thelec.net
- NPS increases holdings in biotech, high-dividend stocks amid market volatility — 매일경제
- Celltrion chief plays down global risks, pledges aggressive shareholder returns — koreabiomed.com
- Celltrion defies South Korea selloff as strong earnings lift outlook – CHOSUNBIZ — Chosunbiz
- Celltrion Expands Treasury Share Cancellation to 9.11 Million Shares Worth 1.93 Trillion Won — Aju Press
How to read these headlines
The common thread is a management-led effort to defend valuation and confidence: record earnings, treasury share retirement/cancellation worth nearly ₩2 trillion, and vocal reassurance from the chief executive about global risks all aim to reinforce the growth narrative and offset broader Korean market volatility. NPS reportedly adding to biotech and high-dividend holdings suggests institutional support, but with the stock already near 52-week highs and RSI elevated, confirming that fundamentals (not just buybacks) sustain the premium multiple is worth watching into the next report.
Headlines are credited to their publishers — click a headline to open the original article. The commentary is written by this site and does not represent the views of any publisher.
💡 Korea Market 101
🔭 Scenarios & What to Watch
The bull case hinges on continued double-digit revenue growth translating into margin expansion toward the sell side’s average target of ₩264,709 (implying upside from current levels, though the low estimate of ₩200,000 sits right at today’s price). The bear case: with 24 analysts already bullish and the stock up sharply, any deceleration in growth or margin at the next earnings release (2026-10-29) could trigger a sharp de-rating from current stretched multiples. Watch the pace of treasury share cancellations and shareholder-return commitments as a valuation support mechanism, plus KRW/USD moves given global biosimilar sales exposure.
💡 Korea Market 101
📚 All stock analysis · More on Celltrion · Market report for this session
Stock report · published 2026-08-12 16:01 KST
For information only — a summary of public data, not a recommendation to buy or sell any security. Source data (Yahoo Finance and others) may be delayed or contain errors. All investment decisions are your own responsibility.
Leave a Reply