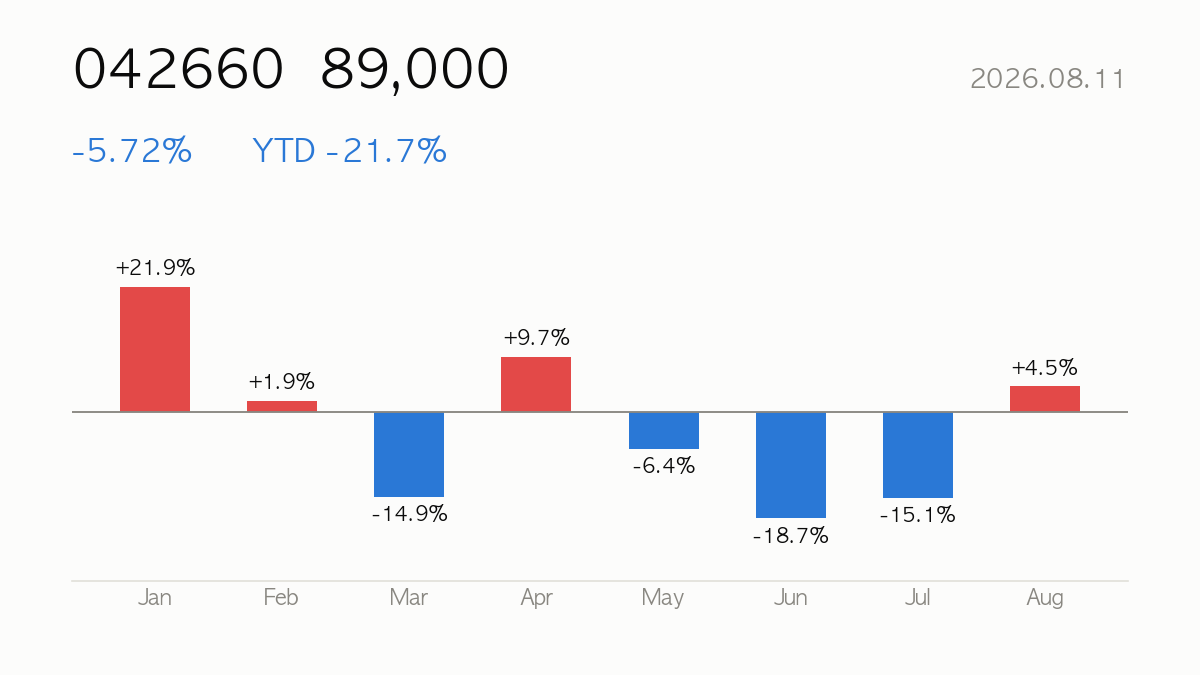
Stock Deep Dive · 2026-08-11
Hanwha Ocean (042660) closed at ₩89,000, down 5.72% on the day. Year-to-date return is -21.7%, sitting at 21% of its 52-week range. Next earnings: 2026-10-26 (in 76 days). Listed in Seoul — for USD-based investors, KRW moves add an FX layer on top of the stock’s local return.
|
Close
₩89,000
-5.72% · YTD -21.7%
|
Market Cap
₩27.27T
Aerospace & Defense
|
Forward P/E
13.9x
PER 17.8x
|
52-wk Range
21%
High ₩154,800 · Low ₩71,300
|
🔍 At a Glance
Hanwha Ocean’s revenue jumped 65.2% YoY last quarter with a 98% operating profit surge and TTM operating margin of 10.5% and ROE of 25.7%, backing the Street’s “buy” consensus (21 analysts, average target ₩135,571 vs. ₩89,000 last close) — a bull case built on shipbuilding recovery, LNG/offshore demand, and defense ambitions. The bear case is just as loud: shares are down 21.7% YTD, -31.5% over three months, and just fell 5.72% in a session, sitting only 21% up its 52-week range after losing Canada’s submarine contract, a deal investors had clearly priced in.
🏢 How It Makes Money
Hanwha Ocean builds commercial vessels (tankers, container ships, bulk/ore carriers, LNG/LPG carriers), offshore platforms (FLNG, FPSO/FPU/FSO, drilling rigs), and defense assets like submarines, alongside engineering/construction and diversified chemical, defense-electronics, and space-launch businesses under the broader Hanwha group umbrella. As a KOSPI-listed chaebol affiliate, its order book and margins are sensitive to global shipping cycles, LNG demand, steel costs, and increasingly, defense export wins — with USD-denominated shipbuilding contracts adding FX translation exposure for foreign holders.
📈 Quarterly Results — Is Business Growing?
| Quarter | Revenue | Op. Income | Net Income | Op. Margin |
|---|---|---|---|---|
| 25Q1 | ₩3.14T | ₩278.3B | ₩215.7B | 8.9% |
| 25Q2 | ₩3.29T | ₩371.7B | ₩148.4B | 11.3% |
| 25Q3 | ₩3.02T | ₩289.8B | ₩269.4B | 9.6% |
| 25Q4 | ₩3.32T | ₩242.5B | ₩612.4B | 7.3% |
| 26Q1 | ₩3.21T | ₩444.6B | ₩500.0B | 13.9% |
| 26Q2* | ₩5.44T | ₩736.1B | ₩692.6B | 13.5% |
* 26Q2 figures come from the company’s preliminary earnings disclosure filed with Korea’s DART on 2026-07-27. They are unaudited and will be replaced once the reviewed quarterly or half-year report is filed.
Latest-quarter revenue up +65.2% versus the same quarter a year ago.

💡 Korea Market 101
💵 Balance Sheet & Runway — How Long Can It Last?
| Item | Value | How to read it |
|---|---|---|
| Cash & equivalents | ₩1.07T | Money available right now |
| Total debt | ₩6.27T | What it owes — larger than cash means a net debt position |
| Free cash flow | ₩-49.3B | Operating cash minus capex — negative means cash is going out |
| Operating cash flow | ₩1.31T | Cash actually generated by the business, which can differ from accounting profit |
| Debt to equity | 91.8% | Debt against shareholders’ equity — above 100% means more debt than equity |
| Current ratio | 1.14 | Short-term assets against short-term liabilities — below 1 signals near-term strain |
At the current burn rate, the cash on hand covers roughly 21.7 years (261 months). The real figure shifts with revenue growth, cost control, and any new financing.
💡 Korea Market 101
⚖️ Valuation — Cheap or Expensive?
| Metric | Value | How to read it |
|---|---|---|
| P/E (trailing) | 17.8x | Price vs last 12 months’ earnings |
| P/E (forward) | 13.9x | Price vs next 12 months’ expected earnings — growth hopes baked in |
| P/S | 2.1x | Price vs revenue — for high-growth names with thin profits |
| P/B | 4.4x | Price vs book value — below 1x means priced under liquidation value |
| PEG | 0.4x | P/E ÷ growth — near 1 is fair for the growth; above 2 is demanding |
| EV/EBITDA | 21.3x | Enterprise value (incl. debt) vs cash generation |
Peer comparison
| Name | Mkt Cap | P/E | Fwd P/E | P/S |
|---|---|---|---|---|
| Hanwha Ocean | ₩27.27T | — | 13.9x | 2.1x |
| HD HYUNDAI HEAVY INDUSTRIES | ₩52.78T | — | 14.1x | 2.7x |
| SamsungHvyInd | ₩18.62T | — | 12.9x | 1.7x |
💡 Korea Market 101
🎯 Street Consensus
- Price target (mean): ₩135,571
- Target high / low: ₩179,000 / ₩63,000
- Implied upside: +52.3%
- Rating: Buy (1.5/5)
- Analysts covering: 21
- Next earnings: 2026-10-26
💡 Korea Market 101
📉 Price Action — Technical Check

| Indicator | Value | How to read it |
|---|---|---|
| RSI (14d) | 54.4 | Above 70 overbought · below 30 oversold |
| vs 60-day MA | -12.9% | Above/below the medium-term trend |
| vs 200-day MA | -25.9% | Above/below the long-term trend |
| Golden/death cross | 50-day below 200-day (bearish alignment) | 50-day MA crossing above (golden) or below (death) the 200-day |
| Volume (vs 20d avg) | 0.8x | 2x+ means a spike in market attention |
💡 Korea Market 101
📰 Recent News
- Hanwha Ocean shares sink 23% as it loses bid to build Canada’s next fleet of submarines — CNBC
- Hanwha Ocean Posts 98% Operating Profit Surge in Q2 Earnings — 조선일보
- Hanwha Ocean Co., Ltd. Revenue Breakdown – KRX:042660 — TradingView
- Hanwha Ocean Stock Tumbles 23% on Lost Sub Deal — Briefs Finance
- Hanwha Ocean shares sink over 20% after Canada loss — Korea JoongAng Daily
- Hanwha Ocean Stock Slumps After Canada Bid Loss — businesskorea.co.kr
How to read these headlines
The common thread is a sharp divergence between strong fundamentals (98% profit surge, robust revenue growth) and a high-profile defense setback — losing Canada’s submarine fleet bid triggered a 20-23% share collapse across multiple outlets. This matters because investors had embedded defense-export optionality into valuation; its removal may weigh on sentiment even as core shipbuilding/offshore earnings remain solid, making it worth confirming whether the drop reflects lost growth optionality or a durable earnings hit.
Headlines are credited to their publishers — click a headline to open the original article. The commentary is written by this site and does not represent the views of any publisher.
💡 Korea Market 101
🔭 Scenarios & What to Watch
Watch whether the post-Canada selloff stabilizes given RSI of 54.4 (neutral) but price still -12.9% below MA60 and -25.9% below MA200 — a technically damaged chart despite forward PER of just 13.9 and PEG of 0.4, suggesting the market may be overreacting or pricing further order risk. The next earnings release (2026-10-26) will be the key test of whether the 65% revenue growth and margin expansion trend continues, or whether lost defense contracts signal broader competitive pressure in Hanwha’s naval pipeline.
Next earnings on 2026-10-26 (in 76 days) — guidance usually decides the stock’s direction more than the reported quarter.
💡 Korea Market 101
📚 All stock analysis · More on Hanwha Ocean · Market report for this session
Stock report · published 2026-08-11 16:00 KST
For information only — a summary of public data, not a recommendation to buy or sell any security. Source data (Yahoo Finance and others) may be delayed or contain errors. All investment decisions are your own responsibility.
Leave a Reply