Stock Deep Dive · 2026-07-28
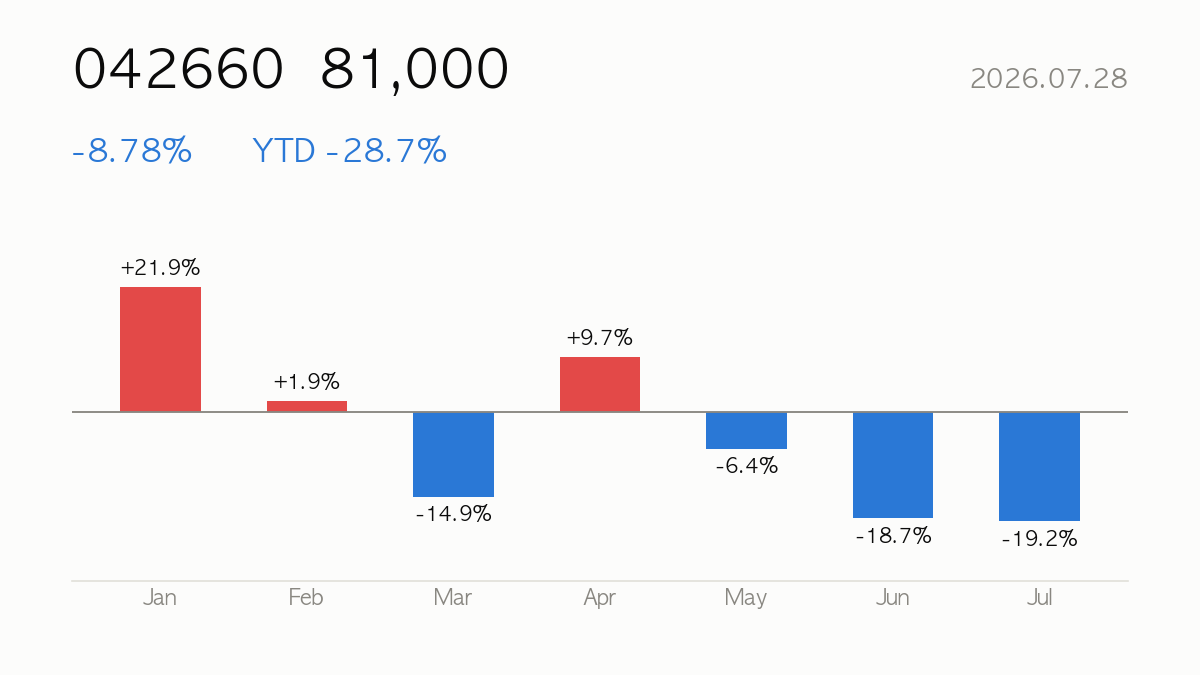
Hanwha Ocean (042660) closed at ₩81,000, down 8.78% on the day. Year-to-date return is -28.7%, sitting at 9% of its 52-week range. Listed in Seoul — for USD-based investors, KRW moves add an FX layer on top of the stock’s local return.
|
Close
₩81,000
-8.78% · YTD -28.7%
|
Market Cap
₩24.81T
Aerospace & Defense
|
Forward P/E
13.5x
PER 16.2x
|
52-wk Range
9%
High ₩154,800 · Low ₩74,000
|
🔍 At a Glance
Hanwha Ocean’s Q2 results were genuinely eye-catching—operating profit up 98% and net income up 367% on 65% sales growth—reflecting a shipbuilder riding strong order momentum and margin recovery (TTM operating margin 10.5%, ROE 25.7%). Yet the stock just cratered, down 8.78% on the day and nearly 46% over six months, after losing the bid for Canada’s next submarine fleet, a sharp reminder that single contract outcomes can swing sentiment hard for a capital-intensive, order-book-driven business.
🏢 How It Makes Money
As part of the Hanwha group (KOSPI-listed), the company builds commercial vessels (tankers, LNG/LPG carriers, container and bulk carriers) alongside offshore platforms, FLNG/FPSO units, and defense-adjacent assets like submarines and naval vessels. Revenue also touches explosives, petrochemicals, and even space-launch engines, giving some diversification beyond pure shipbuilding cycles. Foreign investors should note KRW/USD exposure, since global shipping demand and dollar-denominated contracts drive much of the top line.
📈 Quarterly Results — Is Business Growing?
| Quarter | Revenue | Op. Income | Net Income | Op. Margin |
|---|---|---|---|---|
| 25Q1 | ₩3.14T | ₩278.3B | ₩215.7B | 8.9% |
| 25Q2 | ₩3.29T | ₩371.7B | ₩148.4B | 11.3% |
| 25Q3 | ₩3.02T | ₩289.8B | ₩269.4B | 9.6% |
| 25Q4 | ₩3.32T | ₩242.5B | ₩612.4B | 7.3% |
| 26Q1 | ₩3.21T | ₩444.6B | ₩500.0B | 13.9% |
| 26Q2* | ₩5.44T | ₩736.1B | ₩692.6B | 13.5% |
* 26Q2 figures come from the company’s preliminary earnings disclosure filed with Korea’s DART on 2026-07-27. They are unaudited and will be replaced once the reviewed quarterly or half-year report is filed.
Latest-quarter revenue up +65.2% versus the same quarter a year ago.

💡 Korea Market 101
⚖️ Valuation — Cheap or Expensive?
| Metric | Value | How to read it |
|---|---|---|
| P/E (trailing) | 16.2x | Price vs last 12 months’ earnings |
| P/E (forward) | 13.5x | Price vs next 12 months’ expected earnings — growth hopes baked in |
| P/S | 1.9x | Price vs revenue — for high-growth names with thin profits |
| P/B | 4.0x | Price vs book value — below 1x means priced under liquidation value |
| PEG | 0.4x | P/E ÷ growth — near 1 is fair for the growth; above 2 is demanding |
| EV/EBITDA | 20.3x | Enterprise value (incl. debt) vs cash generation |
Peer comparison
| Name | Mkt Cap | P/E | Fwd P/E | P/S |
|---|---|---|---|---|
| Hanwha Ocean | ₩24.81T | — | 13.5x | 1.9x |
| HD HYUNDAI HEAVY INDUSTRIES | ₩47.32T | — | 13.2x | 2.4x |
| SamsungHvyInd | ₩17.68T | — | 12.1x | 1.6x |
💡 Korea Market 101
🎯 Street Consensus
- Price target (mean): ₩146,500
- Target high / low: ₩180,000 / ₩75,000
- Implied upside: +80.9%
- Rating: Strong Buy (1.5/5)
- Analysts covering: 20
💡 Korea Market 101
📉 Price Action — Technical Check

| Indicator | Value | How to read it |
|---|---|---|
| RSI (14d) | 41.5 | Above 70 overbought · below 30 oversold |
| vs 60-day MA | -25.8% | Above/below the medium-term trend |
| vs 200-day MA | -33.1% | Above/below the long-term trend |
| Golden/death cross | 50-day below 200-day (bearish alignment) | 50-day MA crossing above (golden) or below (death) the 200-day |
| Volume (vs 20d avg) | 0.7x | 2x+ means a spike in market attention |
💡 Korea Market 101
📰 Recent News
- Hanwha Ocean Posts 98% Operating Profit Surge in Q2 Earnings — 조선일보
- Hanwha Ocean shares sink 23% as it loses bid to build Canada’s next fleet of submarines — CNBC
- MIRAE ASSET SECURITIES CO. LTD. Warrant 2026-14.09.26 on Hanwha Ocean Series M034 — TradingView
- Hanwha Ocean shares sink over 20% after Canada loss — Korea JoongAng Daily
- Hot Stock: Hanwha Ocean nosedives 23% upon losing Canadian sub bid — Aju Press
- Hanwha Ocean’s Q2 Net Attributable Income Jumps 367%, Sales Up 65% — marketscreener.com
💡 Korea Market 101
🔭 Scenarios & What to Watch
At 13% below its 52-week range floor and RSI at 41.5, the stock looks oversold near-term, though it still trades over 25% below its 60- and 200-day averages. Bulls point to the strong_buy consensus from 20 analysts with an average target of ₩146,500 (implying substantial upside from ₩81,000), but that gap versus the ₩75,000 low-end estimate suggests real disagreement on order pipeline durability. Watch upcoming earnings and any new defense or LNG contract announcements—wins may offset the Canada setback, while further bid losses could weigh on sentiment.
💡 Korea Market 101
📚 All stock analysis · More on Hanwha Ocean · Market report for this session
Stock report · published 2026-07-28 16:00 KST
For information only — a summary of public data, not a recommendation to buy or sell any security. Source data (Yahoo Finance and others) may be delayed or contain errors. All investment decisions are your own responsibility.
Leave a Reply