Stock Deep Dive · 2026-07-16
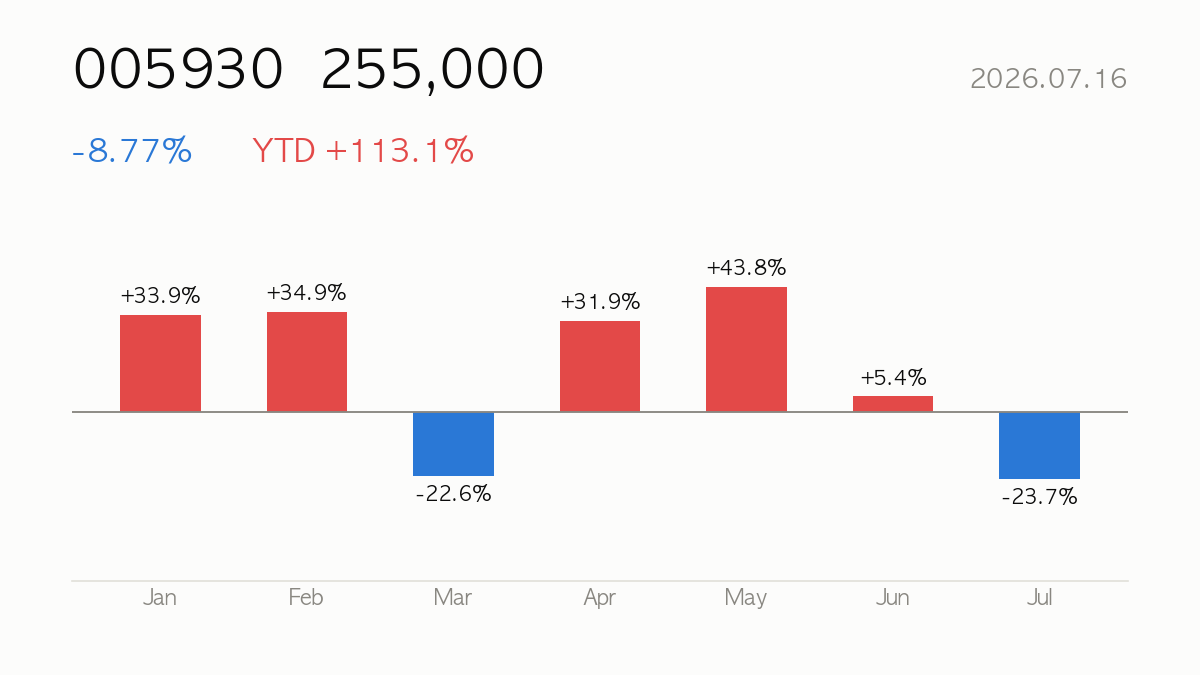
Samsung Electronics (005930) closed at ₩255,000, down 8.77% on the day. Year-to-date return is +113.1%, sitting at 61% of its 52-week range. Next earnings: 2026-07-29 (in 9 days). Listed in Seoul — for USD-based investors, KRW moves add an FX layer on top of the stock’s local return.
|
Close
₩255,000
-8.77% · YTD +113.1%
|
Market Cap
₩1,674.47T
Consumer Electronics
|
Forward P/E
3.9x
PER 20.1x
|
52-wk Range
61%
High ₩374,500 · Low ₩64,900
|
🔍 At a Glance
Samsung Electronics just posted a startling 1,800% profit jump and +69.2% quarterly revenue growth, with a lofty ROE of 18.9% and a forward PER of just 3.9 (PEG 0.2) — figures that scream “cheap” against its growth. Yet the stock cratered -8.77% in a single session and sits -26.4% over the past month, as AI-spending anxieties and worries that memory price hikes are “tapering” (per Morningstar) collide with a stock that’s still up 98.9% YTD.
🏢 How It Makes Money
Samsung runs four divisions — Device eXperience (smartphones, TVs, appliances), Device Solutions (memory chips, foundry), SDC (displays), and Harman (audio/connected car) — plus smaller ventures in cloud, logistics, and digital advertising. Its TTM revenue of ₩388.34T and 24.2% operating margin underscore how central the semiconductor cycle (DS) has become to group profitability, alongside steady DX hardware sales.
📈 Quarterly Results — Is Business Growing?
| Quarter | Revenue | Op. Income | Net Income | Op. Margin |
|---|---|---|---|---|
| 25Q1 | ₩79.14T | ₩6.69T | ₩8.03T | 8.4% |
| 25Q2 | ₩74.57T | ₩4.68T | ₩4.93T | 6.3% |
| 25Q3 | ₩86.06T | ₩12.17T | ₩12.01T | 14.1% |
| 25Q4 | ₩93.84T | ₩20.07T | ₩19.29T | 21.4% |
| 26Q1 | ₩133.87T | ₩57.23T | ₩47.10T | 42.8% |
Latest-quarter revenue up +69.2% versus the same quarter a year ago.

💡 Korea Market 101
⚖️ Valuation — Cheap or Expensive?
| Metric | Value | How to read it |
|---|---|---|
| P/E (trailing) | 20.1x | Price vs last 12 months’ earnings |
| P/E (forward) | 3.9x | Price vs next 12 months’ expected earnings — growth hopes baked in |
| P/S | 4.3x | Price vs revenue — for high-growth names with thin profits |
| P/B | 3.9x | Price vs book value — below 1x means priced under liquidation value |
| PEG | 0.2x | P/E ÷ growth — near 1 is fair for the growth; above 2 is demanding |
| EV/EBITDA | 11.2x | Enterprise value (incl. debt) vs cash generation |
Peer comparison
| Name | Mkt Cap | P/E | Fwd P/E | P/S |
|---|---|---|---|---|
| SamsungElec | ₩1,674.47T | — | 3.9x | 4.3x |
| SK hynix | ₩1,307.55T | — | 4.1x | 9.9x |
| Taiwan Semiconductor Manufactur | $2,066.14B | 29.8x | 18.8x | 0.5x |
| Micron Technology, Inc. | $958.80B | 19.2x | 5.6x | 10.6x |
💡 Korea Market 101
🎯 Street Consensus
- Price target (mean): ₩492,537
- Target high / low: ₩850,000 / ₩210,000
- Implied upside: +93.2%
- Rating: Strong Buy (1.4/5)
- Analysts covering: 36
- Next earnings: 2026-07-29
💡 Korea Market 101
📉 Price Action — Technical Check

| Indicator | Value | How to read it |
|---|---|---|
| RSI (14d) | 32.1 | Above 70 overbought · below 30 oversold |
| vs 60-day MA | -12.8% | Above/below the medium-term trend |
| vs 200-day MA | +38.0% | Above/below the long-term trend |
| Golden/death cross | 50-day above 200-day (bullish alignment) | 50-day MA crossing above (golden) or below (death) the 200-day |
| Volume (vs 20d avg) | 0.8x | 2x+ means a spike in market attention |
💡 Korea Market 101
📰 Recent News
- Samsung Electronics: Preliminary Figures Slightly Soft; We Expect Memory Price Hikes to Taper — Morningstar
- Samsung posts 1,800% jump in profit, but AI spending concerns spook investors — CNBC
- Samsung Electronics (KOSE:A005930) Stock Looks Discounted on Value but Rich After 318% Return — Yahoo Finance
- Why is Samsung Electronics stock plummeting today? — Investing.com
- Regarding the single-stock leveraged exchange-traded fund (ETF) of Samsung Electronics and SK Hynix — 매일경제
- Samsung Electronics considers share buyback for stock bonuses, details undecided — Reuters
💡 Korea Market 101
🔭 Scenarios & What to Watch
Bulls point to a strong-buy consensus from 36 analysts (average target ₩492,537, implying substantial upside from ₩255,000) and a mooted buyback tied to stock bonuses. Bears note RSI at 32.1 (near oversold), price -12.8% below the 60-day average despite being +38% above the 200-day, and heavy retail buying of leveraged Samsung/SK Hynix products — a crowded trade that may amplify volatility. Watch memory pricing trends and the next earnings release on 2026-07-29 for confirmation of whether the AI-driven margin story holds or fades. USD-based investors should also weigh KRW currency swings.
Next earnings on 2026-07-29 (in 9 days) — guidance usually decides the stock’s direction more than the reported quarter.
💡 Korea Market 101
📚 All stock analysis · More on Samsung Electronics · Market report for this session
Auto-generated stock report · 2026-07-19 12:10 KST
For information only — a summary of public data, not a recommendation to buy or sell any security. Source data (Yahoo Finance and others) may be delayed or contain errors. All investment decisions are your own responsibility.
Leave a Reply