Stock Deep Dive · 2026-07-17
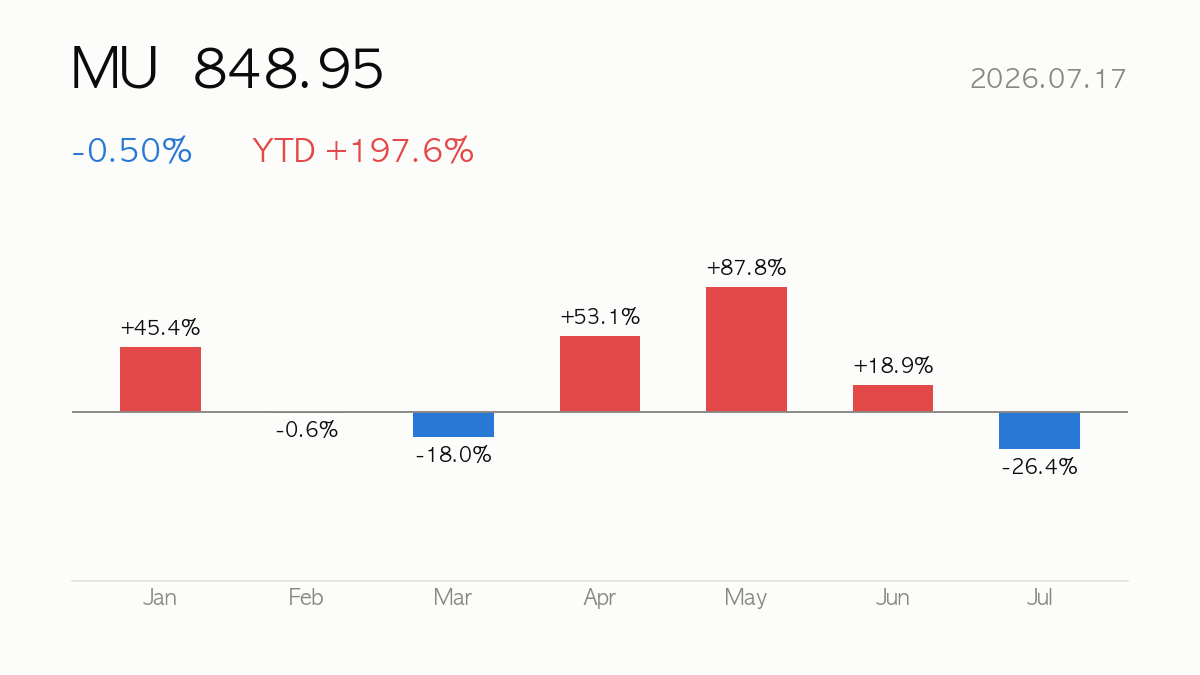
Micron Technology (MU) closed at $848.95, down 0.50% on the day. Year-to-date return is +197.6%, sitting at 65% of its 52-week range. Next earnings: 2026-09-24 (in 67 days).
|
Close
$848.95
-0.50% · YTD +197.6%
|
Market Cap
$958.80B
Semiconductors
|
Forward P/E
5.6x
PER 19.0x
|
52-wk Range
65%
High $1,255.00 · Low $103.38
|
🔍 At a Glance
Micron has been one of 2025’s standout stories, up a staggering 210.9% YTD and 157.2% over six months, riding surging demand for HBM and data-center memory tied to the AI buildout — reflected in a jaw-dropping +345.7% quarterly revenue growth and 65.7% TTM operating margins. But the bear case is right there in the tape: shares are down 13.1% over the past month, RSI sits at a cool 28.6 signaling oversold momentum, and headlines are asking whether Micron has already peaked after this parabolic run.
🏢 How It Makes Money
Micron designs and manufactures memory and storage — DRAM, NAND, high-bandwidth memory, and SSDs — sold through four units: Cloud Memory, Core Data Center, Mobile and Client, and Automotive and Embedded. Its fortunes are tightly linked to memory pricing cycles and, increasingly, to AI infrastructure spend, as HBM and data-center demand now drive outsized growth versus legacy mobile and auto memory.
📈 Quarterly Results — Is Business Growing?
| Quarter | Revenue | Op. Income | Net Income | Op. Margin |
|---|---|---|---|---|
| 25Q2 | $9.30B | $2.17B | $1.89B | 23.3% |
| 25Q3 | $11.31B | $3.69B | $3.20B | 32.6% |
| 25Q4 | $13.64B | $6.14B | $5.24B | 45.0% |
| 26Q1 | $23.86B | $16.14B | $13.79B | 67.6% |
| 26Q2 | $41.46B | $33.32B | $28.24B | 80.4% |
Latest-quarter revenue up +345.7% versus the same quarter a year ago.

💡 Korea Market 101
⚖️ Valuation — Cheap or Expensive?
| Metric | Value | How to read it |
|---|---|---|
| P/E (trailing) | 19.0x | Price vs last 12 months’ earnings |
| P/E (forward) | 5.6x | Price vs next 12 months’ expected earnings — growth hopes baked in |
| P/S | 10.6x | Price vs revenue — for high-growth names with thin profits |
| P/B | 17.7x | Price vs book value — below 1x means priced under liquidation value |
| PEG | 0.1x | P/E ÷ growth — near 1 is fair for the growth; above 2 is demanding |
| EV/EBITDA | 13.8x | Enterprise value (incl. debt) vs cash generation |
Peer comparison
| Name | Mkt Cap | P/E | Fwd P/E | P/S |
|---|---|---|---|---|
| Micron Technology, Inc. | $958.80B | 19.2x | 5.6x | 10.6x |
| SK hynix | ₩1,307.55T | — | 4.1x | 9.9x |
| SamsungElec | ₩1,674.47T | — | 3.9x | 4.3x |
| Western Digital Corporation | $164.49B | 28.6x | 25.7x | 14.0x |
💡 Korea Market 101
🎯 Street Consensus
- Price target (mean): $1,489.57
- Target high / low: $2,200.00 / $361.00
- Implied upside: +75.5%
- Rating: Strong Buy (1.4/5)
- Analysts covering: 42
- Next earnings: 2026-09-24
💡 Korea Market 101
📉 Price Action — Technical Check

| Indicator | Value | How to read it |
|---|---|---|
| RSI (14d) | 24.0 | Above 70 overbought · below 30 oversold |
| vs 60-day MA | -2.0% | Above/below the medium-term trend |
| vs 200-day MA | +75.8% | Above/below the long-term trend |
| Golden/death cross | 50-day above 200-day (bullish alignment) | 50-day MA crossing above (golden) or below (death) the 200-day |
| Volume (vs 20d avg) | 1.2x | 2x+ means a spike in market attention |
💡 Korea Market 101
📰 Recent News
- Here’s What Can End Micron’s Stock Pain — Barron’s
- 3 Semiconductor Stocks to Buy Before AI Demand Explodes in July — 24/7 Wall St.
- What’s Going on With Micron Technology Stock Friday? — Benzinga
- Has Micron Technology Stock Peaked? — The Motley Fool
- Why is Micron Technology stock sliding today? — Investing.com
- Micron Technology (NASDAQ:MU) shares drop; auto deals do not alter AI exposure (MarketWatch) — TechStock²
💡 Korea Market 101
🔭 Scenarios & What to Watch
With a forward PER of just 5.9 versus a trailing PER of 19.8, the market appears to be pricing in continued explosive earnings growth — a gap worth confirming as durable rather than cyclical. Recent weakness, including reports of an 8% single-day drop and broader memory-stock selloffs alongside SanDisk, may weigh on sentiment near-term even as MU trades 83.6% above its 200-day average. Watch the September 24, 2026 earnings date, HBM pricing trends, and whether auto/embedded softness dilutes AI-driven upside.
Next earnings on 2026-09-24 (in 67 days) — guidance usually decides the stock’s direction more than the reported quarter.
💡 Korea Market 101
Auto-generated stock report · 2026-07-18 10:18 KST
For information only — a summary of public data, not a recommendation to buy or sell any security. Source data (Yahoo Finance and others) may be delayed or contain errors. All investment decisions are your own responsibility.
Leave a Reply