Stock Deep Dive · 2026-07-24
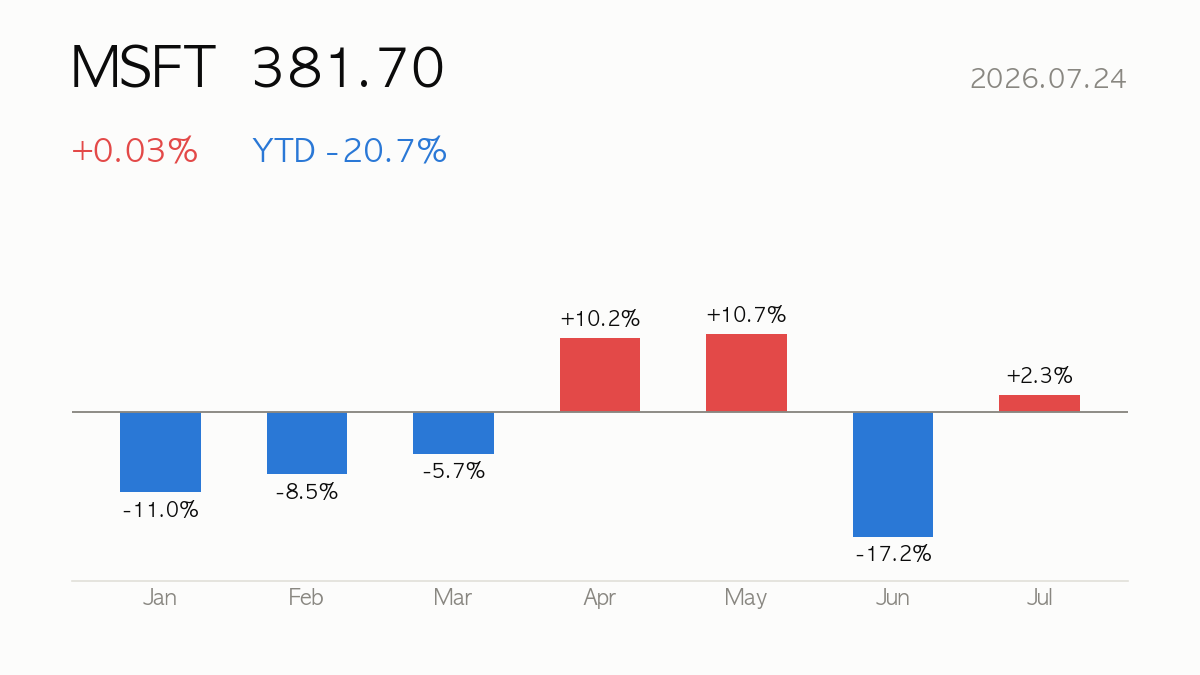
Microsoft (MSFT) closed at $381.70, up 0.03% on the day. Year-to-date return is -20.7%, sitting at 16% of its 52-week range. Next earnings: 2026-07-29 (in 4 days).
|
Close
$381.70
+0.03% · YTD -20.7%
|
Market Cap
$2,835.43B
Software – Infrastructure
|
Forward P/E
19.7x
PER 22.6x
|
52-wk Range
16%
High $555.45 · Low $349.20
|
🔍 At a Glance
Microsoft still posts 18.3% YoY revenue growth, a 46.8% operating margin, and 34% ROE — hallmarks of a dominant, cash-generative franchise trading at a forward PER of 19.7. Yet the stock is down 20.7% YTD, sits just 16% up its 52-week range, and trades below both its 60-day and 200-day averages, suggesting the market remains cautious on near-term AI spending and growth durability.
🏢 How It Makes Money
Microsoft earns through two core engines: Productivity and Business Processes (Microsoft 365, LinkedIn, Dynamics 365, Teams, Copilot) and Intelligent Cloud (Azure, GitHub, Nuance Healthcare, server products). Recurring subscription and cloud revenue underpin the TTM $318.27B top line and its industry-leading margins.
📈 Quarterly Results — Is Business Growing?
| Quarter | Revenue | Op. Income | Net Income | Op. Margin |
|---|---|---|---|---|
| 25Q1 | $70.07B | $32.00B | $25.82B | 45.7% |
| 25Q2 | $76.44B | $34.32B | $27.23B | 44.9% |
| 25Q3 | $77.67B | $37.96B | $27.75B | 48.9% |
| 25Q4 | $81.27B | $38.27B | $38.46B | 47.1% |
| 26Q1 | $82.89B | $38.40B | $31.78B | 46.3% |
Latest-quarter revenue up +18.3% versus the same quarter a year ago.

💡 Korea Market 101
⚖️ Valuation — Cheap or Expensive?
| Metric | Value | How to read it |
|---|---|---|
| P/E (trailing) | 22.6x | Price vs last 12 months’ earnings |
| P/E (forward) | 19.7x | Price vs next 12 months’ expected earnings — growth hopes baked in |
| P/S | 8.9x | Price vs revenue — for high-growth names with thin profits |
| P/B | 8.3x | Price vs book value — below 1x means priced under liquidation value |
| PEG | 1.2x | P/E ÷ growth — near 1 is fair for the growth; above 2 is demanding |
| EV/EBITDA | 15.6x | Enterprise value (incl. debt) vs cash generation |
Peer comparison
| Name | Mkt Cap | P/E | Fwd P/E | P/S |
|---|---|---|---|---|
| Microsoft Corporation | $2,835.43B | 22.7x | 19.7x | 8.9x |
| Alphabet Inc. | $3,910.40B | 16.1x | 21.6x | 8.8x |
| Amazon.com, Inc. | $2,496.83B | 27.7x | 23.4x | 3.4x |
| Oracle Corporation | $331.23B | 19.7x | 10.6x | 4.9x |
💡 Korea Market 101
🎯 Street Consensus
- Price target (mean): $556.75
- Target high / low: $870.00 / $400.00
- Implied upside: +45.9%
- Rating: Strong Buy (1.3/5)
- Analysts covering: 55
- Next earnings: 2026-07-29
💡 Korea Market 101
📉 Price Action — Technical Check

| Indicator | Value | How to read it |
|---|---|---|
| RSI (14d) | 46.6 | Above 70 overbought · below 30 oversold |
| vs 60-day MA | -4.9% | Above/below the medium-term trend |
| vs 200-day MA | -12.2% | Above/below the long-term trend |
| Golden/death cross | 50-day below 200-day (bearish alignment) | 50-day MA crossing above (golden) or below (death) the 200-day |
| Volume (vs 20d avg) | 0.7x | 2x+ means a spike in market attention |
💡 Korea Market 101
📰 Recent News
- Microsoft Earnings Preview: Get Ready for Soaring AI Spending to Sink MSFT Stock — Barchart.com
- Microsoft (MSFT) Stock May Be 43% Undervalued After Fresh AI Deal News — Yahoo Finance Singapore
- Going Into Earnings, Is Microsoft Stock a Buy, a Sell, or Fairly Valued? — Morningstar
- Prediction: Microsoft Stock Will Go Parabolic After July 29. Here’s Why. — Yahoo Finance
- Microsoft Stock (MSFT) Opinions on Morgan Stanley Analyst Coverage — Quiver Quantitative
- Is Microsoft’s stock set for a breakout? This analyst says a major inflection is in the cards. — MarketWatch
💡 Korea Market 101
🔭 Scenarios & What to Watch
The next earnings report on 2026-07-29 is the key catalyst — headlines are split between fears that “soaring AI spending” could pressure margins and bullish calls that the stock could go “parabolic” or is “43% undervalued” post AI-deal news. With RSI at 46.6 (neutral) and price 12.2% below the 200-day average, a decisive move above MA60 may signal renewed momentum, while continued softness could keep MSFT range-bound near 52-week lows. Analyst consensus remains strong_buy (55 analysts, average target 556.75, range 400–870), implying meaningful upside is priced by Street models — but the wide target range underscores real disagreement on AI monetization timing. Confirm Azure growth trends and capex guidance at the print before drawing conclusions.
Next earnings on 2026-07-29 (in 4 days) — guidance usually decides the stock’s direction more than the reported quarter.
💡 Korea Market 101
📚 All stock analysis · More on Microsoft · Market report for this session
Stock report · published 2026-07-25 07:25 KST
For information only — a summary of public data, not a recommendation to buy or sell any security. Source data (Yahoo Finance and others) may be delayed or contain errors. All investment decisions are your own responsibility.
Leave a Reply