Stock Deep Dive · 2026-08-18
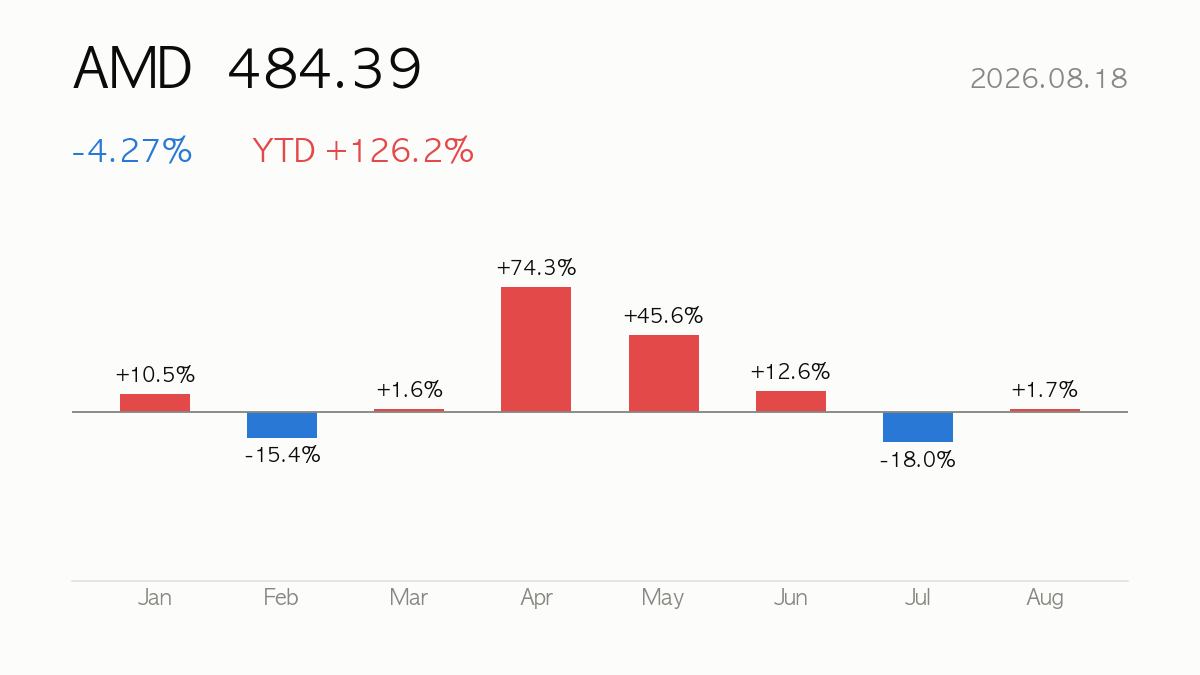
AMD (AMD) closed at $484.39, down 4.27% on the day. Year-to-date return is +126.2%, sitting at 77% of its 52-week range. Next earnings: 2026-11-03 (in 76 days).
|
Close
$484.39
-4.27% · YTD +126.2%
|
Market Cap
$790.75B
Semiconductors
|
Forward P/E
31.3x
PER 122.9x
|
52-wk Range
77%
High $584.73 · Low $149.22
|
🔍 At a Glance
AMD has been one of 2025’s defining AI trades, up 126% year-to-date and 126.8% over six months, powered by a 50.1% year-over-year revenue jump and Street consensus firmly at strong buy with a $612.84 average target. But the stock trades at a trailing PER of 122.9 and EV/EBITDA above 85, meaning today’s price already bakes in years of flawless execution, and a 4.27% single-day drop shows how quickly sentiment can wobble.
🏢 How It Makes Money
AMD designs and sells semiconductors across three segments: Data Center (AI accelerators, EPYC server CPUs), Client and Gaming (Ryzen and Radeon chips for PCs and consoles), and Embedded (FPGAs, adaptive SoCs, and custom silicon). Growth is increasingly tied to AI accelerator demand competing against Nvidia, alongside steady PC and gaming chip sales and semi-custom deals for consoles and other systems.
📈 Quarterly Results — Is Business Growing?
| Quarter | Revenue | Op. Income | Net Income | Op. Margin |
|---|---|---|---|---|
| 25Q2 | $7.68B | $-134M | $872M | -1.7% |
| 25Q3 | $9.25B | $1.27B | $1.24B | 13.7% |
| 25Q4 | $10.27B | $1.75B | $1.51B | 17.1% |
| 26Q1 | $10.25B | $1.48B | $1.38B | 14.4% |
| 26Q2 | $11.54B | $1.99B | $2.30B | 17.3% |
Latest-quarter revenue up +50.1% versus the same quarter a year ago.

💡 Korea Market 101
⚖️ Valuation — Cheap or Expensive?
| Metric | Value | How to read it |
|---|---|---|
| P/E (trailing) | 122.9x | Price vs last 12 months’ earnings |
| P/E (forward) | 31.3x | Price vs next 12 months’ expected earnings — growth hopes baked in |
| P/S | 19.1x | Price vs revenue — for high-growth names with thin profits |
| P/B | 12.6x | Price vs book value — below 1x means priced under liquidation value |
| PEG | 1.1x | P/E ÷ growth — near 1 is fair for the growth; above 2 is demanding |
| EV/EBITDA | 85.5x | Enterprise value (incl. debt) vs cash generation |
Peer comparison
| Name | Mkt Cap | P/E | Fwd P/E | P/S |
|---|---|---|---|---|
| Advanced Micro Devices, Inc. | $790.75B | 124.2x | 31.3x | 19.1x |
| NVIDIA Corporation | $5,322.32B | 33.7x | 17.1x | 21.0x |
| Intel Corporation | $511.09B | — | 47.4x | 9.0x |
| Broadcom Inc. | $1,807.88B | 63.3x | 19.5x | 24.0x |
💡 Korea Market 101
🎯 Street Consensus
- Price target (mean): $612.84
- Target high / low: $1,250.00 / $365.00
- Implied upside: +26.5%
- Rating: Strong Buy (1.5/5)
- Analysts covering: 47
- Next earnings: 2026-11-03
💡 Korea Market 101
📉 Price Action — Technical Check

| Indicator | Value | How to read it |
|---|---|---|
| RSI (14d) | 61.2 | Above 70 overbought · below 30 oversold |
| vs 60-day MA | -5.0% | Above/below the medium-term trend |
| vs 200-day MA | +48.3% | Above/below the long-term trend |
| Golden/death cross | 50-day above 200-day (bullish alignment) | 50-day MA crossing above (golden) or below (death) the 200-day |
| Volume (vs 20d avg) | 0.8x | 2x+ means a spike in market attention |
💡 Korea Market 101
📰 Recent News
- A $210 Billion Reason to Buy AMD Stock Here — Barchart.com
- Cathie Wood’s ARK Invest Adds Nvidia Stake, Sells AMD Stock Across Four ETFs — Yahoo Finance
- Cerebras, Intel, and AMD Shares Fall Ahead of Tonight’s ‘Supernova’ Event — 24/7 Wall St.
- Micron vs. AMD: Only One AI Stock Looks Like a Better Buy Now — Zacks Investment Research
- What’s Going On With AMD Stock Tuesday? — Benzinga
- Not Nvidia. Not AMD. This Chip Stock Will Be the Biggest Winner of the Historic AI Semiconductor Boom. — fool.com
How to read these headlines
The common thread is intensifying scrutiny of AMD’s position in the AI chip race—ARK trimming its stake in favor of Nvidia, comparisons against Micron, and chatter around a rival “Supernova” event all signal investors actively re-ranking AI winners. Because AMD’s valuation already assumes sustained AI-driven growth, any shift in perceived competitive standing versus Nvidia, Micron, or emerging challengers may weigh on sentiment and multiple compression, even if underlying fundamentals hold steady.
Headlines are credited to their publishers — click a headline to open the original article. The commentary is written by this site and does not represent the views of any publisher.
💡 Korea Market 101
🔭 Scenarios & What to Watch
Bull case: continued AI accelerator momentum, margin expansion toward that 15.7% TTM operating margin, and reacceleration in Data Center revenue could justify the lofty PSR of 19.1 and PEG near 1.1. Bear case: any stumble in AI chip shipments or share loss to rivals could hit hard given a stock sitting 48.3% above its 200-day average and 77% up its 52-week range. Watch the next earnings report on November 3, 2026, RSI at 61.2 (not yet overbought), and whether shares hold above the MA60 level, currently 5% below spot.
Next earnings on 2026-11-03 (in 76 days) — guidance usually decides the stock’s direction more than the reported quarter.
💡 Korea Market 101
📚 All stock analysis · More on AMD · Market report for this session
Stock report · published 2026-08-19 07:25 KST
For information only — a summary of public data, not a recommendation to buy or sell any security. Source data (Yahoo Finance and others) may be delayed or contain errors. All investment decisions are your own responsibility.
Leave a Reply