Stock Deep Dive · 2026-08-18
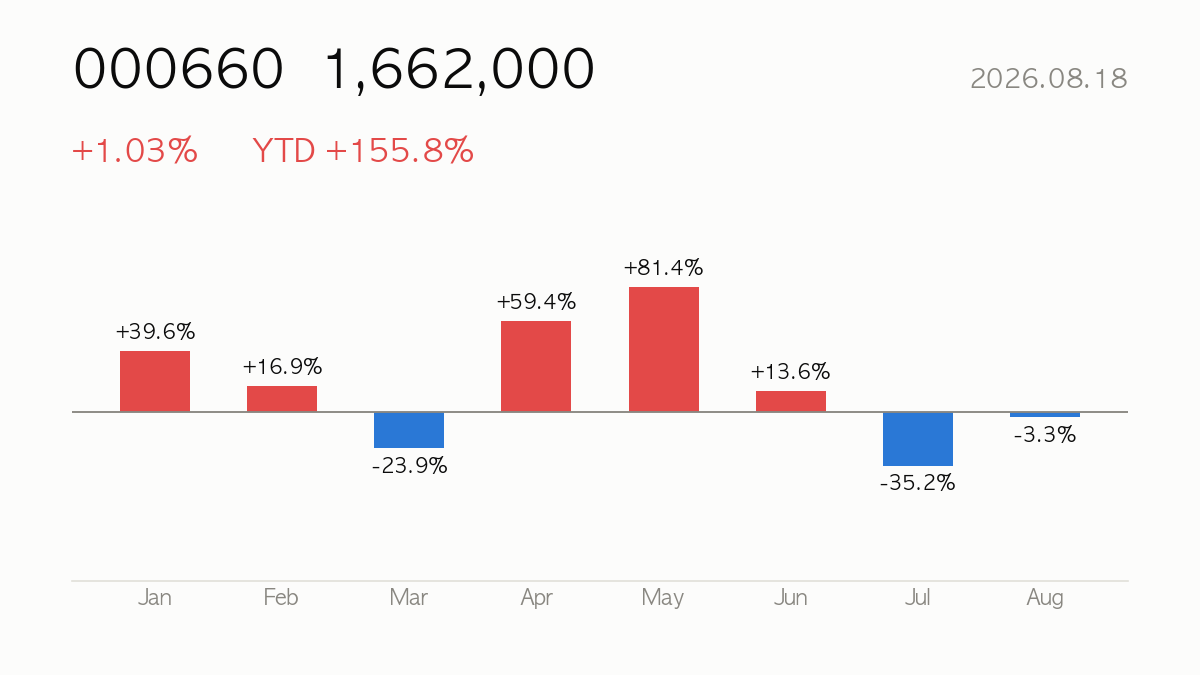
SK hynix (000660) closed at ₩1,662,000, up 1.03% on the day. Year-to-date return is +155.8%, sitting at 52% of its 52-week range. Next earnings: 2026-10-27 (in 70 days). Listed in Seoul — for USD-based investors, KRW moves add an FX layer on top of the stock’s local return.
|
Close
₩1,662,000
+1.03% · YTD +155.8%
|
Market Cap
₩1,179.78T
Semiconductors
|
Forward P/E
3.7x
PER 15.7x
|
52-wk Range
52%
High ₩2,987,000 · Low ₩245,000
|
🔍 At a Glance
SK hynix has ridden the AI memory boom to a +155.8% YTD gain, with revenue up 256.8% YoY last quarter, a 58.6% operating margin, and ROE near 93% — metrics that explain the “strong buy” consensus (39 analysts, average target ₩3.16M, well above the current ₩1.66M price). Yet the stock has pulled back -9.8% over one month and -15.9% over three, sitting at only 52% of its 52-week range, a reminder that memory is a brutally cyclical business and that even a forward PER of 3.7 can compress fast if pricing turns.
🏢 How It Makes Money
SK hynix designs and manufactures DRAM (server, mobile, PC, graphics, consumer), NAND flash, SSDs, and MCP modules, alongside a smaller foundry business for non-memory chips, serving servers, networking, mobile, PC, consumer, and automotive customers worldwide. As part of the SK Group chaebol, it is one of two Korean pillars (alongside Samsung) of the global memory oligopoly, giving it direct leverage to AI-driven demand for high-bandwidth memory used in data-center accelerators.
📈 Quarterly Results — Is Business Growing?
| Quarter | Revenue | Op. Income | Net Income | Op. Margin |
|---|---|---|---|---|
| 25Q1 | ₩17.64T | ₩7.44T | ₩8.11T | 42.2% |
| 25Q2 | ₩22.23T | ₩9.21T | ₩7.00T | 41.4% |
| 25Q3 | ₩24.45T | ₩11.38T | ₩12.60T | 46.6% |
| 25Q4 | ₩32.83T | ₩19.17T | ₩15.22T | 58.4% |
| 26Q1 | ₩52.58T | ₩37.61T | ₩40.33T | 71.5% |
| 26Q2* | ₩79.32T | ₩60.54T | ₩93.82T | 76.3% |
* 26Q2 figures come from the company’s preliminary earnings disclosure filed with Korea’s DART on 2026-07-29. They are unaudited and will be replaced once the reviewed quarterly or half-year report is filed.
Latest-quarter revenue up +256.8% versus the same quarter a year ago.

💡 Korea Market 101
⚖️ Valuation — Cheap or Expensive?
| Metric | Value | How to read it |
|---|---|---|
| P/E (trailing) | 15.7x | Price vs last 12 months’ earnings |
| P/E (forward) | 3.7x | Price vs next 12 months’ expected earnings — growth hopes baked in |
| P/S | 8.9x | Price vs revenue — for high-growth names with thin profits |
| P/B | 9.8x | Price vs book value — below 1x means priced under liquidation value |
| PEG | 0.2x | P/E ÷ growth — near 1 is fair for the growth; above 2 is demanding |
| EV/EBITDA | 7.7x | Enterprise value (incl. debt) vs cash generation |
Peer comparison
| Name | Mkt Cap | P/E | Fwd P/E | P/S |
|---|---|---|---|---|
| SK hynix | ₩1,179.78T | — | 3.7x | 6.2x |
| SamsungElec | ₩1,763.12T | — | 4.0x | 3.6x |
| Micron Technology, Inc. | $1,142.66B | 22.0x | 6.5x | 12.7x |
| Taiwan Semiconductor Manufactur | $2,235.21B | 32.2x | 19.8x | 0.5x |
💡 Korea Market 101
🎯 Street Consensus
- Price target (mean): ₩3,164,332
- Target high / low: ₩5,300,000 / ₩1,200,000
- Implied upside: +90.4%
- Rating: Strong Buy (1.3/5)
- Analysts covering: 39
- Next earnings: 2026-10-27
💡 Korea Market 101
📉 Price Action — Technical Check

| Indicator | Value | How to read it |
|---|---|---|
| RSI (14d) | 54.1 | Above 70 overbought · below 30 oversold |
| vs 60-day MA | -19.4% | Above/below the medium-term trend |
| vs 200-day MA | +34.6% | Above/below the long-term trend |
| Golden/death cross | 50-day above 200-day (bullish alignment) | 50-day MA crossing above (golden) or below (death) the 200-day |
| Volume (vs 20d avg) | 0.9x | 2x+ means a spike in market attention |
💡 Korea Market 101
📰 Recent News
- Investors Remember Why They Love Memory-Chip Stocks — Investor’s Business Daily
- Why SK Hynix Stock Popped Today — Yahoo Finance
- SK hynix: AI Memory Dominance That Wall Street Is Mispricing (NASDAQ:SKHY) — Seeking Alpha
- SK Hynix’s Stock Trades at Around 5 Times Next Year’s Earnings Even After Revenue Grew 257%. Here’s What a Multiple That Low Usually Signals About a Cyclical Business. — The Motley Fool
- Samsung, SK hynix could deliver record $212 bil. in shareholder returns: reports — The Korea Times
- Chips Keep Nasdaq Charged: SanDisk, Micron, SK Hynix Rally Up To 7% On Fresh AI Trade Optimism — NDTV Profit
How to read these headlines
The common thread across headlines is a market-wide re-rating of memory stocks as AI infrastructure spending accelerates demand for DRAM and NAND, lifting SK hynix alongside Micron and SanDisk. The Motley Fool’s framing — a sub-4x forward multiple despite 257% revenue growth — captures the tension between AI optimism and lingering memory-cycle skepticism, a debate worth confirming through upcoming earnings and shareholder-return announcements like the reported $212 billion sector-wide buyback/dividend plans.
Headlines are credited to their publishers — click a headline to open the original article. The commentary is written by this site and does not represent the views of any publisher.
💡 Korea Market 101
🔭 Scenarios & What to Watch
Bulls point to PEG of 0.2 and EV/EBITDA of 7.7 as signs earnings haven’t caught up with the AI memory cycle; bears note the stock trades 19.4% below its 60-day average despite being 34.6% above its 200-day, hinting at a cooling short-term trend within a longer uptrend. Watch the next earnings release on 2026-10-27 for confirmation of pricing and demand trends, plus any shift in RSI (currently neutral at 54.1) that could signal renewed momentum or further consolidation. USD-based investors should also track the won’s exchange rate, since KOSPI-listed SK hynix’s dollar returns depend on FX alongside share performance.
Next earnings on 2026-10-27 (in 70 days) — guidance usually decides the stock’s direction more than the reported quarter.
💡 Korea Market 101
📚 All stock analysis · More on SK hynix · Market report for this session
Stock report · published 2026-08-18 16:01 KST
For information only — a summary of public data, not a recommendation to buy or sell any security. Source data (Yahoo Finance and others) may be delayed or contain errors. All investment decisions are your own responsibility.
Leave a Reply