Stock Deep Dive · 2026-07-29
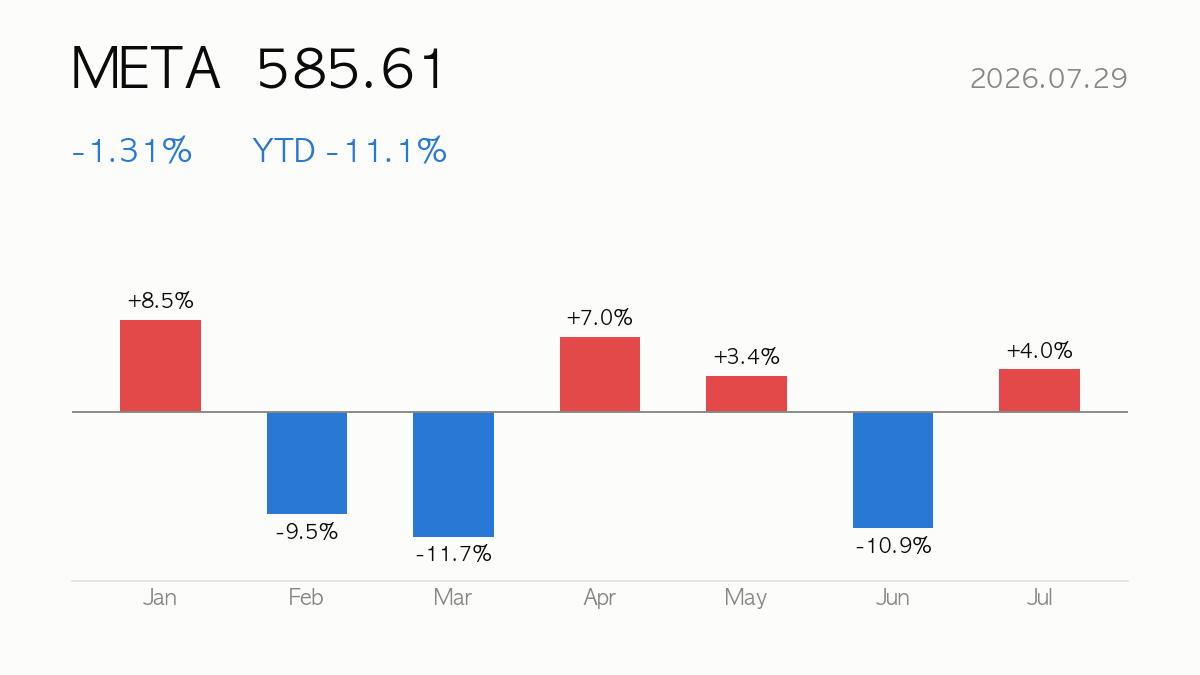
Meta Platforms (META) closed at $585.61, down 1.31% on the day. Year-to-date return is -11.1%, sitting at 24% of its 52-week range. Earnings for the quarter were reported on 2026-07-29 (EPS $6.18 vs $7.22 consensus, -14%).
|
Close
$585.61
-1.31% · YTD -11.1%
|
Market Cap
$1,486.53B
Internet Content & Information
|
Forward P/E
15.8x
PER 21.1x
|
52-wk Range
24%
High $796.25 · Low $520.26
|
🔍 At a Glance
Meta remains a cash-generating juggernaut, with TTM revenue of $214.96B, quarterly revenue growth of +33.1%, a 41.2% operating margin, and ROE near 32.9% — metrics that justify the strong_buy consensus from 57 analysts and an average target of 824.68. Yet shares sit 24% into their 52-week range, down 11.1% YTD and 13.2% over three months, with headlines pointing to a Q2 earnings miss and soft guidance that triggered the latest slide.
🏢 How It Makes Money
Meta’s Family of Apps segment — Facebook, Instagram, Messenger, Threads, and Meta AI — monetizes billions of daily interactions primarily through advertising, while Reality Labs pushes VR headsets and AI glasses as the next connection frontier. The core FoA engine remains the profit driver, funding heavier investment in AI and hardware ambitions.
📈 Quarterly Results — Is Business Growing?
⚠️ The quarter reported on 2026-07-29 is not yet reflected in the table and chart below. The data source (Yahoo Finance) refreshes quarterly financials more than a day after the release, so the table stops at the prior quarter. See the company’s IR materials for the just-reported figures.
| Quarter | Revenue | Op. Income | Net Income | Op. Margin |
|---|---|---|---|---|
| 25Q1 | $42.31B | $17.55B | $16.64B | 41.5% |
| 25Q2 | $47.52B | $20.44B | $18.34B | 43.0% |
| 25Q3 | $51.24B | $20.54B | $2.71B | 40.1% |
| 25Q4 | $59.89B | $24.75B | $22.77B | 41.3% |
| 26Q1 | $56.31B | $22.87B | $26.77B | 40.6% |
Latest-quarter revenue up +33.1% versus the same quarter a year ago.

💡 Korea Market 101
⚖️ Valuation — Cheap or Expensive?
| Metric | Value | How to read it |
|---|---|---|
| P/E (trailing) | 21.1x | Price vs last 12 months’ earnings |
| P/E (forward) | 15.8x | Price vs next 12 months’ expected earnings — growth hopes baked in |
| P/S | 6.9x | Price vs revenue — for high-growth names with thin profits |
| P/B | 6.8x | Price vs book value — below 1x means priced under liquidation value |
| PEG | 0.9x | P/E ÷ growth — near 1 is fair for the growth; above 2 is demanding |
| EV/EBITDA | 13.8x | Enterprise value (incl. debt) vs cash generation |
Peer comparison
| Name | Mkt Cap | P/E | Fwd P/E | P/S |
|---|---|---|---|---|
| Meta Platforms, Inc. | $1,486.53B | 21.3x | 15.8x | 6.9x |
| Alphabet Inc. | $4,117.94B | 16.9x | 22.9x | 9.2x |
| Snap Inc. | $7.84B | — | 6.4x | 1.3x |
| Pinterest, Inc. | $13.69B | 50.9x | 11.0x | 3.1x |
💡 Korea Market 101
🎯 Street Consensus
- Price target (mean): $824.68
- Target high / low: $1,015.00 / $664.46
- Implied upside: +40.8%
- Rating: Strong Buy (1.4/5)
- Analysts covering: 57
- Last earnings: 2026-07-29 — reported
💡 Korea Market 101
📉 Price Action — Technical Check

| Indicator | Value | How to read it |
|---|---|---|
| RSI (14d) | 36.5 | Above 70 overbought · below 30 oversold |
| vs 60-day MA | -3.2% | Above/below the medium-term trend |
| vs 200-day MA | -7.8% | Above/below the long-term trend |
| Golden/death cross | 50-day below 200-day (bearish alignment) | 50-day MA crossing above (golden) or below (death) the 200-day |
| Volume (vs 20d avg) | 1.1x | 2x+ means a spike in market attention |
💡 Korea Market 101
📰 Recent News
- Meta reports second-quarter results after the close — CNBC
- Hilltop Holdings Inc. Trims Stock Holdings in Meta Platforms, Inc. $META — MarketBeat
- Why is Meta Platforms stock tumbling today? — Investing.com
- Prediction: Meta Stock Will Pop After Q2 Earnings. 3 Reasons Why — Yahoo Finance
- Prediction: Meta Stock Will Pop After Q2 Earnings. 3 Reasons Why — The Motley Fool
- Meta Platforms (NASDAQ:META) Shares Slide After Q2 Earnings Miss and Soft Guidance — ChartMill
💡 Korea Market 101
🔭 Scenarios & What to Watch
Bulls point to a forward PER of 15.8 and PEG of 0.9, suggesting growth isn’t fully priced in, especially after the stock reports second-quarter results after the close — a date worth confirming for exact timing. RSI at 36.5 and price sitting 7.8% below the 200-day average signal oversold conditions, but persistent softness versus guidance may weigh on sentiment. Watch for confirmation of ad-revenue durability and Reality Labs spending trends in the next print, alongside any shift in institutional positioning following reports like Hilltop Holdings trimming its stake.
💡 Korea Market 101
📚 All stock analysis · More on Meta Platforms · Market report for this session
Stock report · published 2026-07-30 07:25 KST
For information only — a summary of public data, not a recommendation to buy or sell any security. Source data (Yahoo Finance and others) may be delayed or contain errors. All investment decisions are your own responsibility.
Leave a Reply