Stock Deep Dive · 2026-08-11
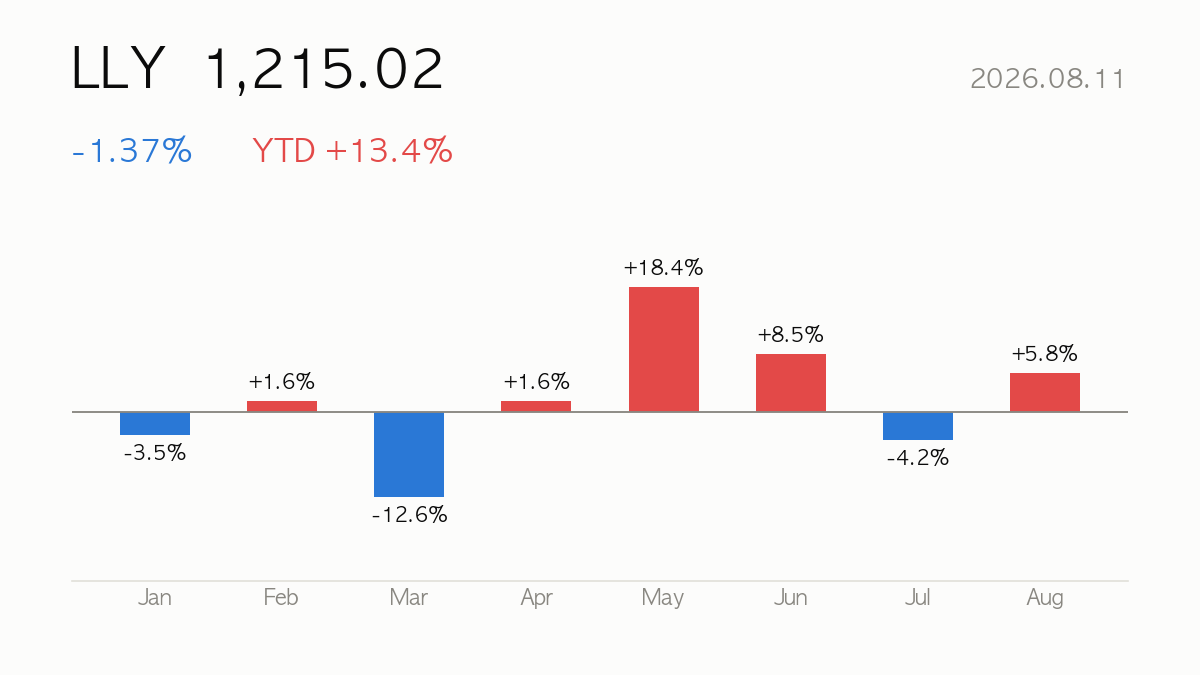
Eli Lilly (LLY) closed at $1,215.02, down 1.37% on the day. Year-to-date return is +13.4%, sitting at 94% of its 52-week range. Earnings for the quarter were reported on 2026-08-05 (EPS $8.38 vs $6.58 consensus, +27%).
|
Close
$1,215.02
-1.37% · YTD +13.4%
|
Market Cap
$1,083.48B
Drug Manufacturers – General
|
Forward P/E
26.1x
PER 40.6x
|
52-wk Range
94%
High $1,249.45 · Low $629.40
|
🔍 At a Glance
Eli Lilly is riding an extraordinary growth wave — quarterly revenue up 47.7% YoY, a 49.7% operating margin, and an eye-popping 102.3% ROE, powered by Mounjaro and Zepbound demand. But the stock trades near the top of its 52-week range (94th percentile) with a trailing PER of 40.6 and EV/EBITDA of 27.4, leaving little room for disappointment if GLP-1 momentum or pipeline catalysts falter.
🏢 How It Makes Money
Lilly’s engine is split between legacy cardiometabolic franchises (Humalog, Jardiance, Trulicity) and its newer blockbuster duo, Mounjaro (diabetes) and Zepbound (obesity), both GLP-1 therapies driving the bulk of recent growth. Oncology products like Erbitux, Jaypirca, and Retevmo add diversification, but the obesity/diabetes segment is now the clear valuation and earnings driver.
📈 Quarterly Results — Is Business Growing?
| Quarter | Revenue | Op. Income | Net Income | Op. Margin |
|---|---|---|---|---|
| 25Q2 | $15.56B | $7.02B | $5.66B | 45.1% |
| 25Q3 | $17.60B | $8.39B | $5.58B | 47.6% |
| 25Q4 | $19.29B | $8.99B | $6.64B | 46.6% |
| 26Q1 | $19.80B | $9.78B | $7.40B | 49.4% |
| 26Q2 | $22.97B | $12.46B | $7.09B | 54.2% |
Latest-quarter revenue up +47.7% versus the same quarter a year ago.

💡 Korea Market 101
⚖️ Valuation — Cheap or Expensive?
| Metric | Value | How to read it |
|---|---|---|
| P/E (trailing) | 40.6x | Price vs last 12 months’ earnings |
| P/E (forward) | 26.1x | Price vs next 12 months’ expected earnings — growth hopes baked in |
| P/S | 13.6x | Price vs revenue — for high-growth names with thin profits |
| P/B | 40.8x | Price vs book value — below 1x means priced under liquidation value |
| PEG | 1.5x | P/E ÷ growth — near 1 is fair for the growth; above 2 is demanding |
| EV/EBITDA | 27.4x | Enterprise value (incl. debt) vs cash generation |
Peer comparison
| Name | Mkt Cap | P/E | Fwd P/E | P/S |
|---|---|---|---|---|
| Eli Lilly and Company | $1,083.48B | 40.8x | 26.1x | 13.6x |
| Novo Nordisk A/S | $206.66B | 11.6x | 14.0x | 0.6x |
| Merck & Company, Inc. | $321.77B | 105.2x | 13.7x | 4.8x |
| Pfizer, Inc. | $151.73B | 35.0x | 9.2x | 2.4x |
💡 Korea Market 101
🎯 Street Consensus
- Price target (mean): $1,299.01
- Target high / low: $1,600.00 / $850.00
- Implied upside: +6.9%
- Rating: Buy (1.7/5)
- Analysts covering: 27
- Last earnings: 2026-08-05 — reported
💡 Korea Market 101
📉 Price Action — Technical Check

| Indicator | Value | How to read it |
|---|---|---|
| RSI (14d) | 58.4 | Above 70 overbought · below 30 oversold |
| vs 60-day MA | +6.3% | Above/below the medium-term trend |
| vs 200-day MA | +17.3% | Above/below the long-term trend |
| Golden/death cross | 50-day above 200-day (bullish alignment) | 50-day MA crossing above (golden) or below (death) the 200-day |
| Volume (vs 20d avg) | 0.6x | 2x+ means a spike in market attention |
💡 Korea Market 101
📰 Recent News
- Five-Star Analyst Raises Price Target on Eli Lilly Stock (LLY) After Blowout Earnings — TipRanks
- Eli Lilly’s weight loss pill gets first European approval — plus, oil holds back stocks — cnbc.com
- Cramer’s Analyst Says Eli Lilly’s GLP-1 Stock Rally Has Years Left to Run — Yahoo Finance
- Eli Lilly Stock’s Next Climb Runs Through A Pill, Not Just An Injection — Trefis
- Eli Lilly Upgraded, Best Buy Downgraded: Updated Rankings on Top Blue-Chip Stocks — InvestorPlace
- Better GLP-1 Stock to Buy: Eli Lilly or Viking Therapeutics? — The Motley Fool
How to read these headlines
The headlines share one throughline: Lilly’s oral GLP-1 pill and European approval are extending the obesity-drug narrative beyond injectables, reinforcing analyst optimism (price-target hikes, upgrades, bullish comparisons to Viking Therapeutics) that the growth runway has “years left.” This matters because the market has already priced in exceptional execution — a 26.1 forward PER assumes the pill and geographic expansion convert smoothly into revenue, so any stumble in trial data or reimbursement may weigh on sentiment despite strong current fundamentals.
Headlines are credited to their publishers — click a headline to open the original article. The commentary is written by this site and does not represent the views of any publisher.
💡 Korea Market 101
🔭 Scenarios & What to Watch
Bull case: continued GLP-1 prescription growth, successful oral pill rollout, and expanding international approvals (like the recent European nod for the weight-loss pill) sustain premium multiples toward the analyst high target of 1,600. Bear case: any manufacturing bottleneck, pricing pressure, or competitive inroads from rivals could compress margins from today’s elevated 49.7% level, especially with the stock already up 24.8% over three months and RSI at 58.4 signaling stretched-but-not-extreme momentum. The next earnings release on 2026-10-29 will be the key checkpoint for confirming whether triple-digit revenue growth persists or normalizes.
💡 Korea Market 101
📚 All stock analysis · More on Eli Lilly · Market report for this session
Stock report · published 2026-08-12 07:25 KST
For information only — a summary of public data, not a recommendation to buy or sell any security. Source data (Yahoo Finance and others) may be delayed or contain errors. All investment decisions are your own responsibility.
Leave a Reply