Stock Deep Dive · 2026-07-21
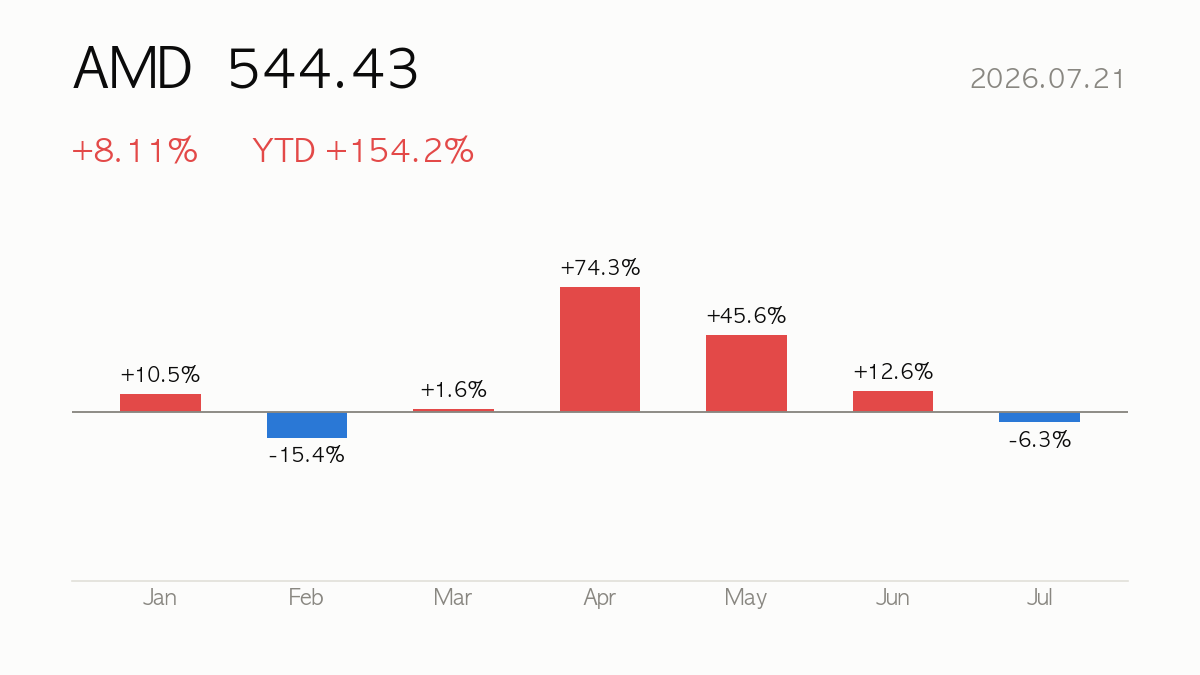
AMD (AMD) closed at $544.43, up 8.11% on the day. Year-to-date return is +154.2%, sitting at 91% of its 52-week range. Next earnings: 2026-08-05 (in 13 days).
|
Close
$544.43
+8.11% · YTD +154.2%
|
Market Cap
$887.75B
Semiconductors
|
Forward P/E
40.4x
PER 177.2x
|
52-wk Range
91%
High $584.73 · Low $149.22
|
🔍 At a Glance
AMD shares jumped 8.11% to 544.43 today, riding fresh confidence from a major AI-chip customer win — Microsoft reportedly signing on for AMD’s new Helios rack AI system — and now sit up a staggering 154.2% YTD, 91% of the way up their 52-week band. The bull case: accelerating Data Center demand, +37.8% revenue growth last quarter, and a Strong Buy consensus from 47 analysts. The bear case: valuation is extreme (trailing PER 177.2, EV/EBITDA 109.4), ROE is a modest 8.1%, and the average analyst target of 541.66 is essentially where the stock already trades.
🏢 How It Makes Money
AMD designs semiconductors across three segments: Data Center (AI accelerators, EPYC processors, GPUs), Client and Gaming (Ryzen CPUs, Radeon graphics), and Embedded (FPGAs, adaptive SoCs, data processing units). Its growth engine is increasingly AI infrastructure — accelerators and rack-scale systems like Helios competing directly with Nvidia for hyperscaler budgets, alongside legacy PC and gaming chip sales.
📈 Quarterly Results — Is Business Growing?
| Quarter | Revenue | Op. Income | Net Income | Op. Margin |
|---|---|---|---|---|
| 25Q1 | $7.44B | $806M | $709M | 10.8% |
| 25Q2 | $7.68B | $-134M | $872M | -1.7% |
| 25Q3 | $9.25B | $1.27B | $1.24B | 13.7% |
| 25Q4 | $10.27B | $1.75B | $1.51B | 17.1% |
| 26Q1 | $10.25B | $1.48B | $1.38B | 14.4% |
Latest-quarter revenue up +37.8% versus the same quarter a year ago.

💡 Korea Market 101
⚖️ Valuation — Cheap or Expensive?
| Metric | Value | How to read it |
|---|---|---|
| P/E (trailing) | 177.2x | Price vs last 12 months’ earnings |
| P/E (forward) | 40.4x | Price vs next 12 months’ expected earnings — growth hopes baked in |
| P/S | 23.7x | Price vs revenue — for high-growth names with thin profits |
| P/B | 14.1x | Price vs book value — below 1x means priced under liquidation value |
| PEG | 1.2x | P/E ÷ growth — near 1 is fair for the growth; above 2 is demanding |
| EV/EBITDA | 109.4x | Enterprise value (incl. debt) vs cash generation |
Peer comparison
| Name | Mkt Cap | P/E | Fwd P/E | P/S |
|---|---|---|---|---|
| Advanced Micro Devices, Inc. | $887.75B | 180.3x | 40.4x | 23.7x |
| NVIDIA Corporation | $5,020.77B | 31.7x | 16.1x | 19.8x |
| Intel Corporation | $529.99B | — | 64.9x | 9.9x |
| Broadcom Inc. | $1,838.80B | 64.3x | 19.9x | 24.4x |
💡 Korea Market 101
🎯 Street Consensus
- Price target (mean): $541.66
- Target high / low: $725.00 / $320.00
- Implied upside: -0.5%
- Rating: Strong Buy (1.5/5)
- Analysts covering: 47
- Next earnings: 2026-08-05
💡 Korea Market 101
📉 Price Action — Technical Check

| Indicator | Value | How to read it |
|---|---|---|
| RSI (14d) | 44.2 | Above 70 overbought · below 30 oversold |
| vs 60-day MA | +13.6% | Above/below the medium-term trend |
| vs 200-day MA | +81.3% | Above/below the long-term trend |
| Golden/death cross | 50-day above 200-day (bullish alignment) | 50-day MA crossing above (golden) or below (death) the 200-day |
| Volume (vs 20d avg) | 1.0x | 2x+ means a spike in market attention |
💡 Korea Market 101
📰 Recent News
- AMD Stock Rises on Vote of Confidence From a Big AI Chip Customer — Barron’s
- Advanced Micro Devices (AMD) Stock May Look Rich On Cash Flow But Cheap On Sales — simplywall.st
- AMD, Micron, SK Hynix climb as semiconductor complex attempt recovery — Yahoo Finance
- AMD launches Helios, its first rack AI system to rival Nvidia, adding Microsoft as newest buyer — CNBC
- Cathie Wood sells $11.7 million of tumbling semiconductor stock — thestreet.com
- AMD’s stock climbs, and a new Microsoft deal is only part of the reason — MarketWatch
💡 Korea Market 101
🔭 Scenarios & What to Watch
Momentum hinges on AI infrastructure orders converting into revenue; further hyperscaler deals (following Microsoft) could extend the rally, while any slowdown in AI capex may weigh on sentiment given the stretched multiples. RSI at 44.2 suggests cooling short-term momentum despite the price being 81.3% above the 200-day average. Watch the next earnings report on 2026-08-05 for confirmation that Data Center growth and margins justify current pricing — and monitor whether analyst targets (320–725 range) get revised as new AI deals materialize.
Next earnings on 2026-08-05 (in 13 days) — guidance usually decides the stock’s direction more than the reported quarter.
💡 Korea Market 101
📚 All stock analysis · More on AMD · Market report for this session
Auto-generated stock report · 2026-07-22 07:25 KST
For information only — a summary of public data, not a recommendation to buy or sell any security. Source data (Yahoo Finance and others) may be delayed or contain errors. All investment decisions are your own responsibility.
Leave a Reply