Stock Deep Dive · 2026-08-27
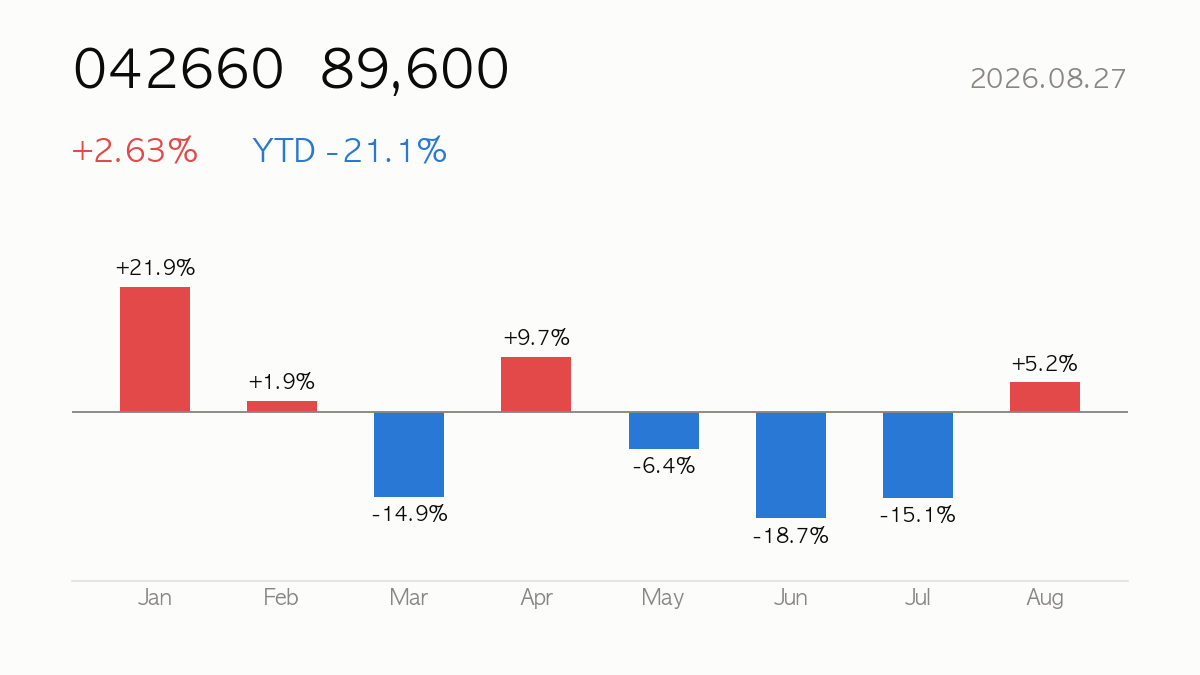
Hanwha Ocean (042660) closed at ₩89,600, up 2.63% on the day. Year-to-date return is -21.1%, sitting at 22% of its 52-week range. Next earnings: 2026-10-26 (in 60 days). Listed in Seoul — for USD-based investors, KRW moves add an FX layer on top of the stock’s local return.
|
Close
₩89,600
+2.63% · YTD -21.1%
|
Market Cap
₩27.45T
Aerospace & Defense
|
Forward P/E
14.0x
PER 17.9x
|
52-wk Range
22%
High ₩154,800 · Low ₩71,300
|
🏢 How It Makes Money
Hanwha Ocean Co., Ltd. operates as a shipbuilding and offshore contractor in South Korea and internationally. The company offers commercial vessels, including tankers, container carriers, bulk carriers, ore carriers, liquefied natural gas (LNG) and liquefied petroleum gas carriers, LNG floating storage regasification units, chemical carriers, and other vessels; and FLNG, fixed platforms, and drilling rigs; and FPSO/FPU/FSOs for offshore oil and gas exploration and production, as well as provision of engineering and construction, including commercial and residential building, infrastructure, environmental facilities, and power plants. It is also provides electronic detonators, blasting system
📈 Quarterly Results — Is Business Growing?
| Quarter | Revenue | Op. Income | Net Income | Op. Margin |
|---|---|---|---|---|
| 25Q1 | ₩3.14T | ₩278.3B | ₩215.7B | 8.9% |
| 25Q2 | ₩3.29T | ₩371.7B | ₩148.4B | 11.3% |
| 25Q3 | ₩3.02T | ₩289.8B | ₩269.4B | 9.6% |
| 25Q4 | ₩3.32T | ₩242.5B | ₩612.4B | 7.3% |
| 26Q1 | ₩3.21T | ₩444.6B | ₩500.0B | 13.9% |
| 26Q2* | ₩5.44T | ₩736.1B | ₩692.6B | 13.5% |
* 26Q2 figures come from the company’s preliminary earnings disclosure filed with Korea’s DART on 2026-07-27. They are unaudited and will be replaced once the reviewed quarterly or half-year report is filed.
Latest-quarter revenue up +65.2% versus the same quarter a year ago.

💡 Korea Market 101
💵 Balance Sheet & Runway — How Long Can It Last?
| Item | Value | How to read it |
|---|---|---|
| Cash & equivalents | ₩1.47T | Money available right now |
| Total debt | ₩6.19T | What it owes — larger than cash means a net debt position |
| Free cash flow | ₩-502.5B | Operating cash minus capex — negative means cash is going out |
| Operating cash flow | ₩1.51T | Cash actually generated by the business, which can differ from accounting profit |
| Debt to equity | 82.2% | Debt against shareholders’ equity — above 100% means more debt than equity |
| Current ratio | 1.21 | Short-term assets against short-term liabilities — below 1 signals near-term strain |
At the current burn rate, the cash on hand covers roughly 2.9 years (35 months). The real figure shifts with revenue growth, cost control, and any new financing.
💡 Korea Market 101
⚖️ Valuation — Cheap or Expensive?
| Metric | Value | How to read it |
|---|---|---|
| P/E (trailing) | 17.9x | Price vs last 12 months’ earnings |
| P/E (forward) | 14.0x | Price vs next 12 months’ expected earnings — growth hopes baked in |
| P/S | 2.1x | Price vs revenue — for high-growth names with thin profits |
| P/B | 4.4x | Price vs book value — below 1x means priced under liquidation value |
| PEG | 0.4x | P/E ÷ growth — near 1 is fair for the growth; above 2 is demanding |
| EV/EBITDA | 15.9x | Enterprise value (incl. debt) vs cash generation |
Peer comparison
| Name | Mkt Cap | P/E | Fwd P/E | P/S |
|---|---|---|---|---|
| Hanwha Ocean | ₩27.45T | — | 14.0x | 1.8x |
| HD HYUNDAI HEAVY INDUSTRIES | ₩49.32T | — | 13.2x | 2.5x |
| SamsungHvyInd | ₩17.94T | — | 12.4x | 1.6x |
💡 Korea Market 101
🎯 Street Consensus
- Price target (mean): ₩135,571
- Target high / low: ₩179,000 / ₩63,000
- Implied upside: +51.3%
- Rating: none
- Analysts covering: 21
- Next earnings: 2026-10-26
💡 Korea Market 101
📉 Price Action — Technical Check

| Indicator | Value | How to read it |
|---|---|---|
| RSI (14d) | 48.5 | Above 70 overbought · below 30 oversold |
| vs 60-day MA | -6.9% | Above/below the medium-term trend |
| vs 200-day MA | -23.8% | Above/below the long-term trend |
| Golden/death cross | 50-day below 200-day (bearish alignment) | 50-day MA crossing above (golden) or below (death) the 200-day |
| Volume (vs 20d avg) | 0.6x | 2x+ means a spike in market attention |
💡 Korea Market 101
📰 Recent News
- Hanwha Ocean shares sink 23% as it loses bid to build Canada’s next fleet of submarines — CNBC
- Hanwha Ocean Stock Tumbles 23% on Lost Sub Deal — Briefs Finance
- Hanwha Ocean Shares Sink After Losing Canada Sub Deal to Germany — Bloomberg
- Hanwha Ocean Stock Slumps After Canada Bid Loss — Businesskorea
- Hanwha Ocean shares sink over 20% after Canada loss — Korea JoongAng Daily
- Hanwha, Fincantieri shares rise after Trump opens navy shipbuilding to foreign yards — Baird Maritime
Headlines are credited to their publishers — click a headline to open the original article. The commentary is written by this site and does not represent the views of any publisher.
💡 Korea Market 101
🔭 Scenarios & What to Watch
Next earnings on 2026-10-26 (in 60 days) — guidance usually decides the stock’s direction more than the reported quarter.
💡 Korea Market 101
📚 All stock analysis · More on Hanwha Ocean · Market report for this session
Stock report · published 2026-08-27 16:00 KST
For information only — a summary of public data, not a recommendation to buy or sell any security. Source data (Yahoo Finance and others) may be delayed or contain errors. All investment decisions are your own responsibility.
Leave a Reply