Stock Deep Dive · 2026-08-21
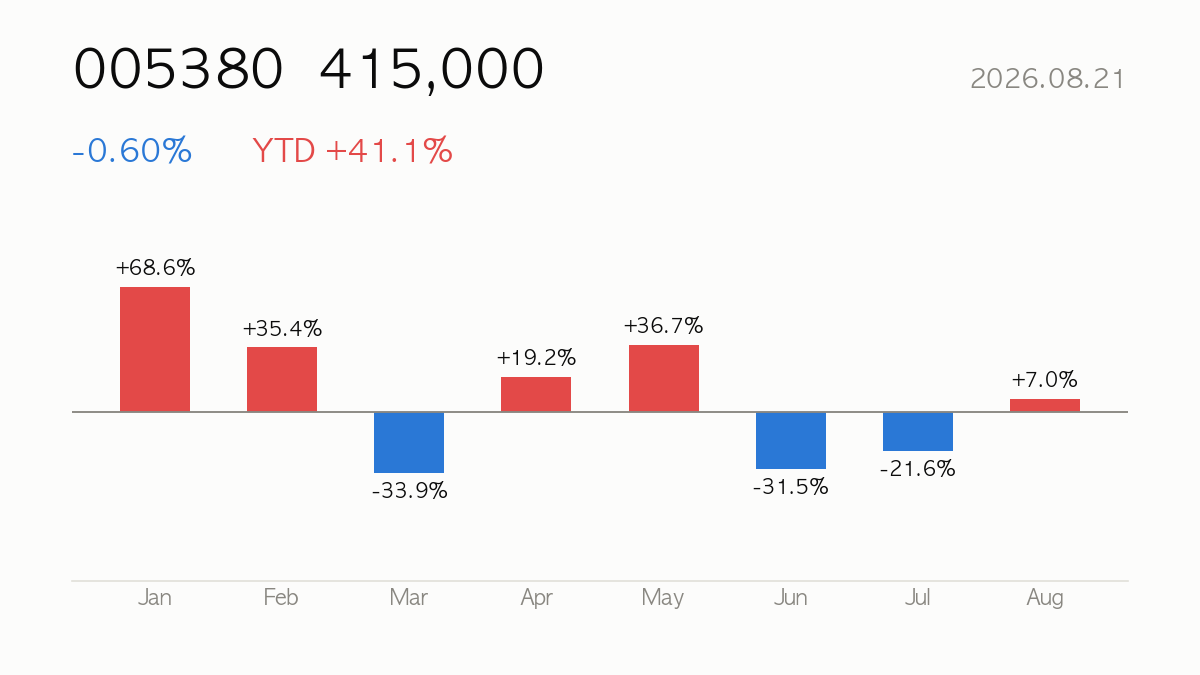
Hyundai Motor (005380) closed at ₩415,000, down 0.60% on the day. Year-to-date return is +41.1%, sitting at 35% of its 52-week range. Earnings for the quarter were reported on 2026-08-13 (EPS ₩9,621 vs ₩10,591 consensus, -9%). Listed in Seoul — for USD-based investors, KRW moves add an FX layer on top of the stock’s local return.
|
Close
₩415,000
-0.60% · YTD +41.1%
|
Market Cap
₩108.66T
Auto Manufacturers
|
Forward P/E
8.5x
PER 12.6x
|
52-wk Range
35%
High ₩783,000 · Low ₩213,000
|
🔍 At a Glance
Hyundai Motor trades at just 8.5x forward earnings and 0.9x book value despite a 41.1% YTD gain, with 31 analysts rating it “buy” and an average target (₩676,843) implying substantial upside from ₩415,000. The bull case rests on cheap valuation, a strong SUV/hybrid lineup, and speculative tailwinds (Nvidia tie-up chatter, Atlas optimism); the bear case is a brutal 3-month drawdown of -37.2%, price sitting 16.8% below its 60-day average, and a thin 5.5% operating margin that leaves little room for error if global auto demand slumps.
🏢 How It Makes Money
Hyundai manufactures and sells vehicles across combustion, hybrid, EV, and commercial lines (Elantra, Tucson, Ioniq, Santa Fe, Palisade, and more), supplemented by a captive Finance segment offering auto loans and credit services. With TTM revenue of ₩188.71 trillion and only +1.9% quarterly YoY growth, volume and mix (particularly SUV and hybrid share) drive profitability more than top-line expansion.
📈 Quarterly Results — Is Business Growing?
| Quarter | Revenue | Op. Income | Net Income | Op. Margin |
|---|---|---|---|---|
| 25Q1 | ₩44.41T | ₩3.63T | ₩3.16T | 8.2% |
| 25Q2 | ₩48.29T | ₩3.60T | ₩3.00T | 7.5% |
| 25Q3 | ₩46.72T | ₩2.54T | ₩2.26T | 5.4% |
| 25Q4 | ₩46.84T | ₩1.70T | ₩1.03T | 3.6% |
| 26Q1 | ₩45.94T | ₩2.51T | ₩2.34T | 5.5% |
| 26Q2* | ₩49.22T | ₩2.85T | ₩2.52T | 5.8% |
* 26Q2 figures come from the company’s preliminary earnings disclosure filed with Korea’s DART on 2026-07-23. They are unaudited and will be replaced once the reviewed quarterly or half-year report is filed.
Latest-quarter revenue up +1.9% versus the same quarter a year ago.

💡 Korea Market 101
⚖️ Valuation — Cheap or Expensive?
| Metric | Value | How to read it |
|---|---|---|
| P/E (trailing) | 12.6x | Price vs last 12 months’ earnings |
| P/E (forward) | 8.5x | Price vs next 12 months’ expected earnings — growth hopes baked in |
| P/S | 0.6x | Price vs revenue — for high-growth names with thin profits |
| P/B | 0.9x | Price vs book value — below 1x means priced under liquidation value |
| EV/EBITDA | 21.1x | Enterprise value (incl. debt) vs cash generation |
Peer comparison
| Name | Mkt Cap | P/E | Fwd P/E | P/S |
|---|---|---|---|---|
| HyundaiMtr | ₩108.66T | — | 8.5x | 0.6x |
| KIA CORP. | ₩50.88T | — | 5.5x | 0.4x |
| Toyota Motor Corporation | $227.63B | 8.6x | 12.2x | 0.0x |
| General Motors Company | $77.92B | 38.0x | 5.8x | 0.4x |
💡 Korea Market 101
💰 Dividend — What It Pays Back
- Dividend yield: 2.40%
- Dividend per share: ₩10,000
- 5-year average yield: 4.02% — below its historical average at the current price
- Payout ratio: 30.4%
💡 Korea Market 101
🎯 Street Consensus
- Price target (mean): ₩676,843
- Target high / low: ₩900,000 / ₩463,129
- Implied upside: +63.1%
- Rating: Buy (1.7/5)
- Analysts covering: 31
- Last earnings: 2026-08-13 — reported
💡 Korea Market 101
📉 Price Action — Technical Check

| Indicator | Value | How to read it |
|---|---|---|
| RSI (14d) | 59.7 | Above 70 overbought · below 30 oversold |
| vs 60-day MA | -16.8% | Above/below the medium-term trend |
| vs 200-day MA | -9.0% | Above/below the long-term trend |
| Golden/death cross | 50-day above 200-day (bullish alignment) | 50-day MA crossing above (golden) or below (death) the 200-day |
| Volume (vs 20d avg) | 0.6x | 2x+ means a spike in market attention |
💡 Korea Market 101
📰 Recent News
- [REPORTER’S NOTEBOOK] Hyundai Motor’s stock rally puts Munoz to test — The Korea Times
- Hyundai Stock And Rivian In Focus As Luxury EV SUVs Return — simplywall.st
- Hyundai Shares Down 4.8% as Next Tucson Aims for Model with 24% of U.S. July Sales — TechStock²
- Hyundai Motor Stock Plummets 27% as Automotive Sector Slumps — 조선일보
- Hyundai Motor shares rise 15% to hit record high amid Nvidia tie-up speculation — Yahoo Finance
- Hyundai Motor Stock Sees Revaluation on Atlas Optimism — Businesskorea
How to read these headlines
The headlines paint a stock whipsawed by narrative rather than steady fundamentals—plunges tied to “automotive sector slumps” followed by surges on Nvidia and Atlas speculation. This volatility, layered atop genuine product news (Tucson’s strong U.S. showing, new EV SUV competition), suggests the market is still searching for a clear read on Hyundai’s tech and EV positioning, which may weigh on near-term price stability even as valuation multiples remain historically undemanding.
Headlines are credited to their publishers — click a headline to open the original article. The commentary is written by this site and does not represent the views of any publisher.
💡 Korea Market 101
🔭 Scenarios & What to Watch
The next earnings release on 2026-10-29 will be the key checkpoint for whether the recent volatility—shares swung from a 27% plunge to a 15% record-high spike—reflects fundamentals or sentiment. Watch U.S. sales share for the new Tucson (reportedly 24% of July U.S. volume for its segment), any concrete details behind the Nvidia/Atlas speculation, and whether margins hold near 5.5% amid EV/luxury SUV competition from rivals like Rivian. FX-sensitive USD investors should also monitor the won, since Hyundai’s export-heavy model ties earnings translation to currency swings.
💡 Korea Market 101
📚 All stock analysis · More on Hyundai Motor · Market report for this session
Stock report · published 2026-08-21 16:01 KST
For information only — a summary of public data, not a recommendation to buy or sell any security. Source data (Yahoo Finance and others) may be delayed or contain errors. All investment decisions are your own responsibility.
Leave a Reply