US Market Report · as of 2026-08-24 NY close
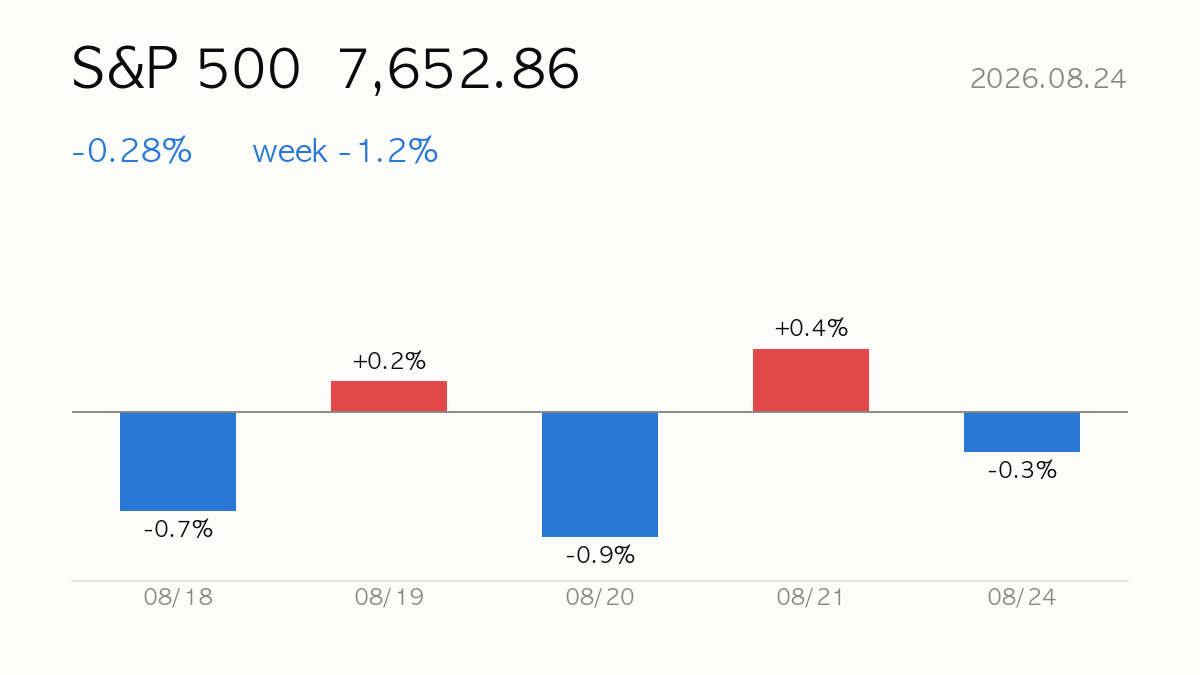
The S&P 500 closed at 7,652.86, down 0.28% on the day. Overall regime call: INFLATION.
|
S&P 500 Close
7,652.86
-0.28% · -1.9% vs peak
|
VIX
15.9
Calm <20
|
USD/KRW
1,381.9
-0.64% · 1M -6.3%
|
Regime
INFLATION
🟢 Entries allowed
|
📝 US Market Wrap
■ Market Overview & Leaders
A split session on Wall Street: the Dow eked out a +0.26% gain to 53,417.16, while the S&P 500 slipped -0.28% to 7,652.86 and the Nasdaq dropped -0.76% to 25,980.19. The real damage was in chips — the PHLX Semiconductor index tumbled -2.70% to 11,423.17, dragging Nvidia (-2.9%), AMD (-3.5%) and Intel (-3.1%) lower alongside Tesla (-3.8%). Defensive and payments names shone instead, led by Mastercard (+3.3%), Visa (+3.1%) and Walmart (+2.7%), as investors rotated ahead of Nvidia’s earnings and looming inflation data.
■ Flows & Breadth
Breadth was actually positive — 23 advancers versus 17 decliners among large caps — diverging from the Nasdaq’s steeper decline, underscoring that mega-cap tech and semis, not the broader market, drove the index-level weakness. VIX rose +4.76% to 15.85, signaling growing caution, while the Korean won firmed slightly against the dollar (1,381.86, -0.64%).
■ Takeaway
Despite headline tech losses, resilient breadth and a firmer Dow suggest rotation rather than panic. All eyes now turn to Nvidia’s earnings and inflation data as catalysts for the next move. 📊
📊 Market Snapshot
| Index | Close | 1D | 5D | 1M | vs Peak |
|---|---|---|---|---|---|
| S&P 500 | 7,652.86 | -0.28% | -1.2% | +3.2% | -1.9% |
| Nasdaq | 25,980.19 | -0.76% | -2.5% | +4.0% | -4.1% |
| Dow | 53,417 | +0.26% | -0.1% | +2.8% | -1.7% |
| PHLX Semiconductor | 11,423.2 | -2.70% | -9.5% | -3.3% | -21.9% |
| VIX | 15.9 | +4.76% | +4.3% | -14.7% | -28.7% |
| USD/KRW | 1,381.9 | -0.64% | -2.4% | -6.3% | -11.1% |
💡 Korea Market 101

🏷️ Large-Cap Movers (Today)
| Gainers | Chg | Losers | Chg |
|---|---|---|---|
| Mastercard | +3.3% | Tesla | -3.8% |
| Visa | +3.1% | AMD | -3.5% |
| Walmart | +2.7% | Intel | -3.1% |
| Costco | +2.5% | NVIDIA | -2.9% |
| UnitedHealth | +2.2% | Oracle | -2.7% |
Large-cap breadth: 23 up · 17 down (of 40)
The index fell, but more stocks rose than fell — losses were concentrated in a few heavyweights.
💡 Korea Market 101
🔄 Sector Rotation
| Sector | 1M | 3M | Score | Type |
|---|---|---|---|---|
| Technology | +7.2% | +2.8% | 23.5 | Growth |
| Health Care | +18.8% | +27.4% | 19.2 | Defensive |
| Consumer Discretionary | +9.9% | +9.5% | 12.5 | Growth |
| Financials | +5.7% | +13.0% | 11.7 | Defensive |
| Energy | +9.6% | +2.9% | 9.1 | Defensive |
| Industrials | +0.3% | +13.5% | 9.1 | — |
| Communication Services | +7.9% | -4.8% | 2.6 | Growth |
| Materials | -6.1% | -5.0% | -0.1 | — |
💡 Korea Market 101
📐 Market Breadth
(40 names)
| Above 200-DMA | Above 50-DMA | Up over 1M | 52-wk highs | 52-wk lows |
|---|---|---|---|---|
| 70% | 55% | 62% | 0% | 0% |
💡 Korea Market 101
📰 Headlines
- S&P 500, Nasdaq end down on tech stocks, investors weigh Iran moves — Reuters
- Stock Market Today: Dow Jones, S&P 500, Nasdaq 100 Futures Slip Ahead of Data-Heavy Week, Nvidia Earnings — Benzinga
- Stock Market Midday, Aug. 24: Dow Edges Higher as Chip Weakness Pressures Nasdaq — The Motley Fool
- JPMorgan says be ready to sell stocks as technical warnings pile up heading into September — Business Insider
- Tech drags S&P 500, Nasdaq lower as Iran tensions, Nvidia earnings loom — The Spokesman-Review
- U.S. Stocks Mixed on Artificial-Intelligence Jitters — WSJ
- Futures are flat as investors await Nvidia earnings, inflation report due later this week: Live updates — CNBC
- Equal-weight S&P 500 is leading the 2026 market and its flagship trade just hit $100 billion — CNBC
Headlines are credited to their publishers — click a headline to open the original article.
💡 Korea Market 101
🌐 Macro Dashboard
| Indicator | Level | 1M | Signal |
|---|---|---|---|
| US 10Y yield | 0.86 | — | ▼ |
| Dollar Index (DXY) | 118.06 | -1.4% | — |
| Gold | 4,715 | +15.9% | ▼ |
| WTI Crude | 86.50 | +6.9% | — |
| Bitcoin | 78,859 | +24.3% | ▲ |
💡 Korea Market 101
🌡️ Regime & Risk Diagnosis
- Regime call: INFLATION — Inflationary — growth with rising price pressure
- Allocation guide: Tilt toward real assets and value
💡 Korea Market 101
🎯 System Watchlist
Sectors in focus: Financials 7 names · Consumer Discretionary 7 names · Health Care 5 names · Technology 5 names · Communication Services 2 names
| Name | Mkt | Sector | Style | Score | Target | Stop | Status |
|---|---|---|---|---|---|---|---|
| HSIC | US | Health Care | Swing | 100 | +11.2% | -5.6% | Watching |
| ZBRA | US | Technology | Swing | 100 | +20.0% | -10.0% | Watching |
| CINF | US | Financials | Swing | 100 | +19.0% | -9.5% | Watching |
| PFG | US | Financials | Swing | 100 | +15.6% | -7.8% | Watching |
| NWSA | US | Communication Services | Swing | 100 | +18.3% | -9.1% | Watching |
| SBUX | US | Consumer Discretionary | Swing | 100 | +17.6% | -8.8% | Watching |
| DXCM | US | Health Care | Swing | 100 | +20.0% | -10.0% | Watching |
| CDW | US | Technology | Swing | 100 | +20.0% | -10.0% | Watching |
| GEN | US | Technology | Swing | 100 | +20.0% | -10.0% | Watching |
| STLD | US | Materials | Swing | 90 | +20.0% | -10.0% | Watching |
| CHTR | US | Communication Services | Squeeze | 90 | +20.0% | -10.0% | Watching |
| KMB | US | Consumer Staples | Swing | 90 | +19.6% | -9.8% | Watching |
💡 Korea Market 101
🤖 System Trading Status
Closed today:
| Name | Mkt | Exit type | Held | P&L |
|---|---|---|---|---|
| 인사이트 | US | ROTATION_EXIT | 5d | +2.36% |
6 open positions — average unrealized P&L +0.83% (5 winning / 1 losing)

💡 Korea Market 101
Published 2026-08-25 07:16 KST
For information only — not investment advice or a solicitation. All investment decisions are your own responsibility.
Leave a Reply