Stock Deep Dive · 2026-08-10
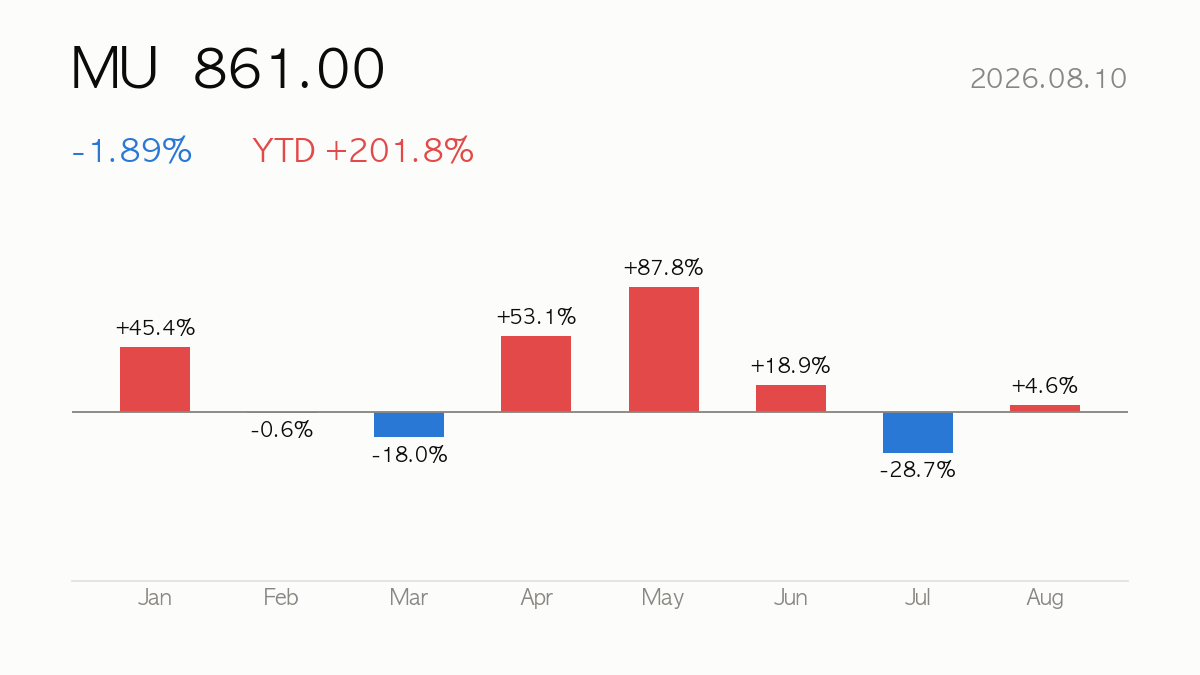
Micron Technology (MU) closed at $861.00, down 1.89% on the day. Year-to-date return is +201.8%, sitting at 66% of its 52-week range. Next earnings: 2026-09-23 (in 43 days).
|
Close
$861.00
-1.89% · YTD +201.8%
|
Market Cap
$972.41B
Semiconductors
|
Forward P/E
5.6x
PER 19.3x
|
52-wk Range
66%
High $1,255.00 · Low $113.46
|
🔍 At a Glance
Micron has been a monster this year — up 201.8% YTD and 105.4% over six months — powered by a memory shortage that has pushed quarterly revenue up 345.7% YoY and lifted TTM operating margin to a stunning 65.7% with ROE at 66.6%. The bull case: a forward PER of just 5.6 against trailing 19.3 suggests the Street expects earnings to keep compounding, and analyst consensus (43 strong-buy ratings, average target $1,501.98) implies enormous further upside. The bear case: the stock is already down 12.1% over the past month, trades 8.3% below its 60-day moving average, and richly valued on PBR (18.0) and PSR (10.8) — metrics that punish any wobble in the memory cycle.
🏢 How It Makes Money
Micron designs and manufactures memory and storage chips — DRAM, NAND, high-bandwidth memory, SSDs — sold across Cloud, Core Data Center, Mobile/Client, and Automotive/Embedded business units. Its fortunes track global memory pricing cycles, and the current AI-driven data center buildout, especially demand for HBM, is the key swing factor behind its margin surge.
📈 Quarterly Results — Is Business Growing?
| Quarter | Revenue | Op. Income | Net Income | Op. Margin |
|---|---|---|---|---|
| 25Q2 | $9.30B | $2.17B | $1.89B | 23.3% |
| 25Q3 | $11.31B | $3.69B | $3.20B | 32.6% |
| 25Q4 | $13.64B | $6.14B | $5.24B | 45.0% |
| 26Q1 | $23.86B | $16.14B | $13.79B | 67.6% |
| 26Q2 | $41.46B | $33.32B | $28.24B | 80.4% |
Latest-quarter revenue up +345.7% versus the same quarter a year ago.

💡 Korea Market 101
⚖️ Valuation — Cheap or Expensive?
| Metric | Value | How to read it |
|---|---|---|
| P/E (trailing) | 19.3x | Price vs last 12 months’ earnings |
| P/E (forward) | 5.6x | Price vs next 12 months’ expected earnings — growth hopes baked in |
| P/S | 10.8x | Price vs revenue — for high-growth names with thin profits |
| P/B | 18.0x | Price vs book value — below 1x means priced under liquidation value |
| PEG | 0.1x | P/E ÷ growth — near 1 is fair for the growth; above 2 is demanding |
| EV/EBITDA | 14.2x | Enterprise value (incl. debt) vs cash generation |
Peer comparison
| Name | Mkt Cap | P/E | Fwd P/E | P/S |
|---|---|---|---|---|
| Micron Technology, Inc. | $972.41B | 19.5x | 5.6x | 10.8x |
| SK hynix | ₩1,007.99T | — | 3.1x | 5.3x |
| SamsungElec | ₩1,510.31T | — | 3.4x | 3.1x |
| Western Digital Corporation | $151.09B | 18.1x | 13.8x | 11.7x |
💡 Korea Market 101
🎯 Street Consensus
- Price target (mean): $1,501.98
- Target high / low: $2,200.00 / $361.00
- Implied upside: +74.4%
- Rating: Strong Buy (1.4/5)
- Analysts covering: 43
- Next earnings: 2026-09-23
💡 Korea Market 101
📉 Price Action — Technical Check

| Indicator | Value | How to read it |
|---|---|---|
| RSI (14d) | 40.6 | Above 70 overbought · below 30 oversold |
| vs 60-day MA | -8.3% | Above/below the medium-term trend |
| vs 200-day MA | +60.0% | Above/below the long-term trend |
| Golden/death cross | 50-day above 200-day (bullish alignment) | 50-day MA crossing above (golden) or below (death) the 200-day |
| Volume (vs 20d avg) | 0.6x | 2x+ means a spike in market attention |
💡 Korea Market 101
📰 Recent News
- Micron Technology Stock Surged On A Shortage The Company Had Already Described — finance.yahoo.com
- Micron Could Reclaim Its Previous Highs (NASDAQ:MU) — Seeking Alpha
- Don’t Assume Micron Will Share SanDisk’s Fate. Here’s Why. — barchart.com
- Unpacking the Latest Pullback in Micron Stock — The Motley Fool
- Micron Technology Stock Is Gaining Monday: What’s Going On? – Micron Technology (NASDAQ:MU) — Benzinga
- Finivi Inc. Purchases New Position in Micron Technology, Inc. $MU — MarketBeat
How to read these headlines
The headlines converge on one theme: a persistent memory shortage is the engine behind Micron’s rally, even after the news was seemingly “already known,” suggesting the market is still repricing how long and how severe this cycle will run. Comparisons to SanDisk’s differing fate and fresh institutional buying (Finivi’s new position) reinforce that investors are debating durability versus a cyclical peak — a distinction that will directly shape earnings estimates and the stock’s premium valuation.
Headlines are credited to their publishers — click a headline to open the original article. The commentary is written by this site and does not represent the views of any publisher.
💡 Korea Market 101
🔭 Scenarios & What to Watch
The next earnings report on 2026-09-23 will be the key checkpoint for whether the shortage-driven pricing power persists or fades. Watch DRAM/NAND spot pricing trends, HBM capacity commentary, and whether RSI near 40.6 signals further near-term consolidation before any resumption toward the 52-week high zone. A break below the 60-day average trend or signs of customer inventory normalization would be worth confirming against bullish targets as high as $2,200.
Next earnings on 2026-09-23 (in 43 days) — guidance usually decides the stock’s direction more than the reported quarter.
💡 Korea Market 101
📚 All stock analysis · More on Micron Technology · Market report for this session
Stock report · published 2026-08-11 07:26 KST
For information only — a summary of public data, not a recommendation to buy or sell any security. Source data (Yahoo Finance and others) may be delayed or contain errors. All investment decisions are your own responsibility.
Leave a Reply