Stock Deep Dive · 2026-08-13
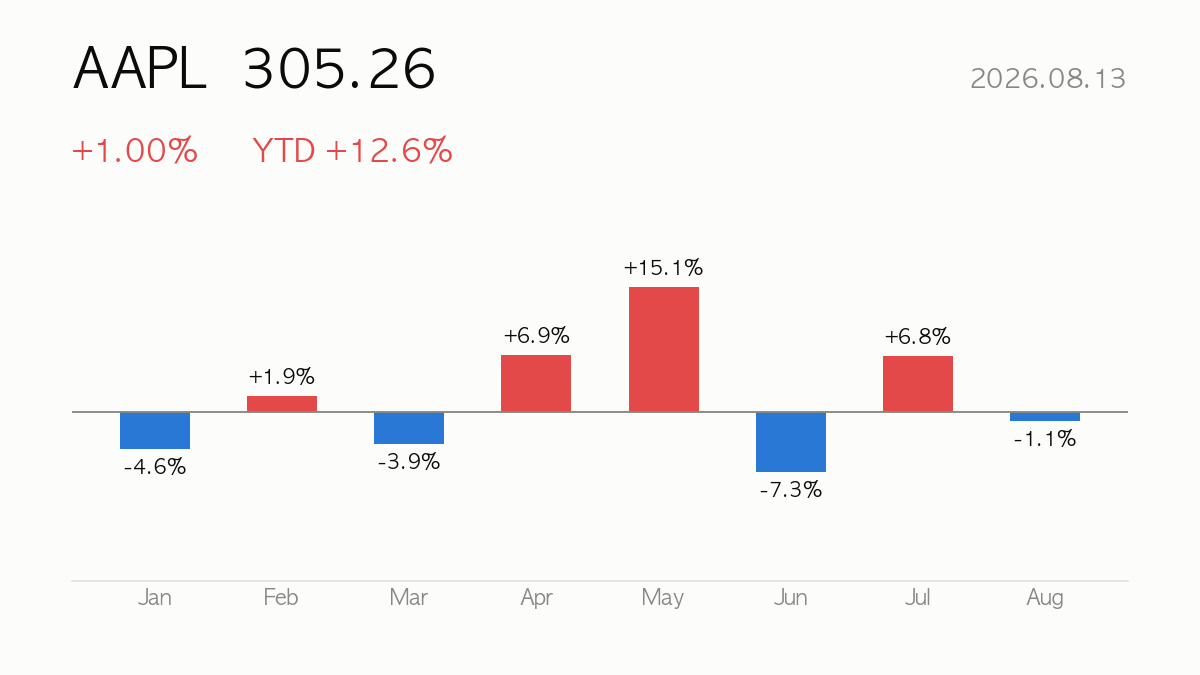
Apple (AAPL) closed at $305.26, up 1.00% on the day. Year-to-date return is +12.6%, sitting at 68% of its 52-week range. Next earnings: 2026-10-29 (in 76 days).
|
Close
$305.26
+1.00% · YTD +12.6%
|
Market Cap
$4,455.02B
Consumer Electronics
|
Forward P/E
32.1x
PER 34.6x
|
52-wk Range
68%
High $344.57 · Low $223.78
|
🔍 At a Glance
Apple sits at $305.26, up 12.6% year-to-date but down 6.7% over the past month, with revenue growth accelerating (+16.4% YoY last quarter) and a 33.2% operating margin that underscores the durability of its ecosystem. Bulls point to the buy-rated consensus (41 analysts, average target 322.28) and strong ROE of 148.8%, while bears note stretched valuation (PER 34.6, PEG 2.5, PBR 60.4) and a recent string of downgrades tied to product-cycle doubts.
🏢 How It Makes Money
Apple’s engine remains iPhone hardware paired with a fast-growing services layer — App Store, AppleCare, cloud, and subscriptions like Apple Arcade — supplemented by Mac, iPad, and wearables. The high-margin services mix is central to sustaining the 33%+ operating margin even as hardware cycles fluctuate.
📈 Quarterly Results — Is Business Growing?
| Quarter | Revenue | Op. Income | Net Income | Op. Margin |
|---|---|---|---|---|
| 25Q2 | $94.04B | $28.20B | $23.43B | 30.0% |
| 25Q3 | $102.47B | $32.43B | $27.47B | 31.6% |
| 25Q4 | $143.76B | $50.85B | $42.10B | 35.4% |
| 26Q1 | $111.18B | $35.88B | $29.58B | 32.3% |
| 26Q2 | $109.42B | $35.70B | $29.79B | 32.6% |
Latest-quarter revenue up +16.4% versus the same quarter a year ago.

💡 Korea Market 101
⚖️ Valuation — Cheap or Expensive?
| Metric | Value | How to read it |
|---|---|---|
| P/E (trailing) | 34.6x | Price vs last 12 months’ earnings |
| P/E (forward) | 32.1x | Price vs next 12 months’ expected earnings — growth hopes baked in |
| P/S | 9.5x | Price vs revenue — for high-growth names with thin profits |
| P/B | 60.4x | Price vs book value — below 1x means priced under liquidation value |
| PEG | 2.5x | P/E ÷ growth — near 1 is fair for the growth; above 2 is demanding |
| EV/EBITDA | 26.4x | Enterprise value (incl. debt) vs cash generation |
Peer comparison
| Name | Mkt Cap | P/E | Fwd P/E | P/S |
|---|---|---|---|---|
| Apple Inc. | $4,455.02B | 34.9x | 32.1x | 9.5x |
| Microsoft Corporation | $3,689.61B | 27.7x | 21.1x | 11.1x |
| Alphabet Inc. | $4,235.96B | 17.4x | 23.5x | 9.5x |
| SamsungElec | ₩1,759.84T | — | 4.0x | 3.6x |
💡 Korea Market 101
🎯 Street Consensus
- Price target (mean): $322.28
- Target high / low: $400.00 / $215.00
- Implied upside: +5.6%
- Rating: Buy (2.1/5)
- Analysts covering: 41
- Next earnings: 2026-10-29
💡 Korea Market 101
📉 Price Action — Technical Check

| Indicator | Value | How to read it |
|---|---|---|
| RSI (14d) | 29.6 | Above 70 overbought · below 30 oversold |
| vs 60-day MA | -1.2% | Above/below the medium-term trend |
| vs 200-day MA | +9.1% | Above/below the long-term trend |
| Golden/death cross | 50-day above 200-day (bullish alignment) | 50-day MA crossing above (golden) or below (death) the 200-day |
| Volume (vs 20d avg) | 0.7x | 2x+ means a spike in market attention |
💡 Korea Market 101
📰 Recent News
- Apple stock downgraded to sell, citing canceled all-glass anniversary iPhone plans — qz.com
- Apple Dropped by 5% After Earnings. History Says This May Happen Next — Yahoo Finance
- Jefferies downgrades Apple, says supply chain checks indicate a planned all-glass iPhone is canceled — CNBC
- Apple Stock Downgraded Ahead Of iPhone 18 Launch — Investor’s Business Daily
- Apple: A Rare Downgrade That Has Nothing To Do With AI (NASDAQ:AAPL) — Seeking Alpha
- AAPL Stock’s Post-Earnings Sell-Off Is Not Over — TipRanks
How to read these headlines
The common thread is a wave of analyst downgrades — Jefferies among them — triggered by supply-chain checks suggesting Apple canceled a planned all-glass “anniversary” iPhone, raising doubts about the iPhone 18 launch’s differentiation and upgrade appeal. Since iPhone remains Apple’s largest single revenue driver, any diminished excitement around the next flagship could pressure unit growth and, by extension, the premium valuation multiples (PER 34.6, EV/EBITDA 26.4) investors currently pay. The post-earnings sell-off commentary reinforces that sentiment is fragile right now, making the upcoming design and launch narrative worth confirming closely.
Headlines are credited to their publishers — click a headline to open the original article. The commentary is written by this site and does not represent the views of any publisher.
💡 Korea Market 101
🔭 Scenarios & What to Watch
The stock trades 9.1% above its 200-day average but just -1.2% versus the 60-day line, and RSI at 29.6 suggests near-term oversold conditions after the pullback. Watch the next earnings date, 2026-10-29, for updated iPhone 18 cycle commentary; a rebound above MA60 would support the bull case, while continued erosion toward the 215 analyst low may confirm bear concerns. Confirm actual supply-chain details behind the all-glass iPhone cancellation reports before drawing conclusions.
Next earnings on 2026-10-29 (in 76 days) — guidance usually decides the stock’s direction more than the reported quarter.
💡 Korea Market 101
📚 All stock analysis · More on Apple · Market report for this session
Stock report · published 2026-08-14 07:25 KST
For information only — a summary of public data, not a recommendation to buy or sell any security. Source data (Yahoo Finance and others) may be delayed or contain errors. All investment decisions are your own responsibility.
Leave a Reply