Stock Deep Dive · 2026-08-19
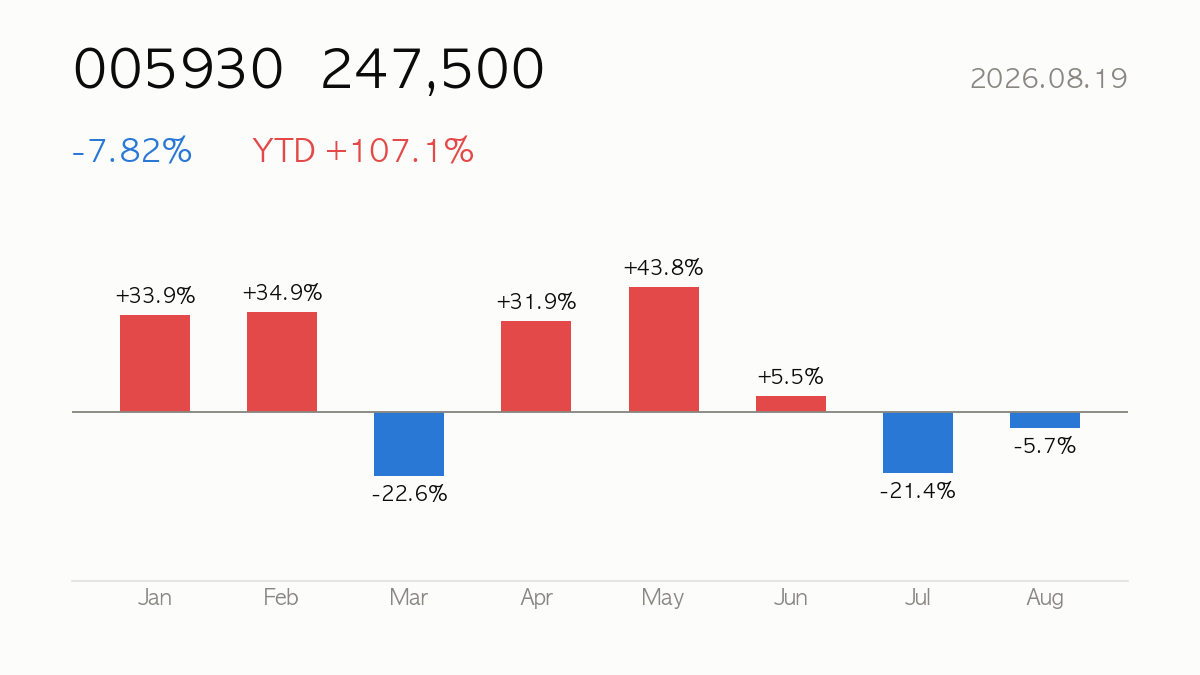
Samsung Electronics (005930) closed at ₩247,500, down 7.82% on the day. Year-to-date return is +107.1%, sitting at 59% of its 52-week range. Next earnings: 2026-10-28 (in 70 days). Listed in Seoul — for USD-based investors, KRW moves add an FX layer on top of the stock’s local return.
|
Close
₩247,500
-7.82% · YTD +107.1%
|
Market Cap
₩1,625.22T
Consumer Electronics
|
Forward P/E
3.7x
PER 19.5x
|
52-wk Range
59%
High ₩374,500 · Low ₩67,500
|
🔍 At a Glance
Samsung’s headline numbers are striking: TTM revenue growth of +130% YoY, a 24.2% operating margin, ROE near 31%, and a forward PER of just 3.7 versus a trailing 19.5 — a gap that signals the Street expects an earnings inflection, backed by a strong_buy consensus from 36 analysts (average target ₩470,156, well above the current price). The bear case is equally visible today: shares just fell -7.82%, are down -16.3% over three months despite a blistering +107.1% YTD, and sit -14.5% below their 60-day moving average even as they remain +22.6% above the 200-day line — a sign the stock is digesting a huge run-up rather than confirming a clean uptrend.
🏢 How It Makes Money
Samsung spans four divisions: Device Solutions (memory and logic semiconductors), Device eXperience (smartphones, TVs, appliances), SDC (displays), and Harman (audio/connected car). The eye-popping +130% quarterly revenue growth points to semiconductor pricing and demand strength flowing through DS, layered on top of DX’s consumer electronics and mobile base and Harman’s diversified industrial exposure.
📈 Quarterly Results — Is Business Growing?
| Quarter | Revenue | Op. Income | Net Income | Op. Margin |
|---|---|---|---|---|
| 25Q1 | ₩79.14T | ₩6.69T | ₩8.03T | 8.4% |
| 25Q2 | ₩74.57T | ₩4.68T | ₩4.93T | 6.3% |
| 25Q3 | ₩86.06T | ₩12.17T | ₩12.01T | 14.1% |
| 25Q4 | ₩93.84T | ₩20.07T | ₩19.29T | 21.4% |
| 26Q1 | ₩133.87T | ₩57.23T | ₩47.10T | 42.8% |
| 26Q2* | ₩171.50T | ₩89.49T | — | 52.2% |
* 26Q2 figures come from the company’s preliminary earnings disclosure filed with Korea’s DART on 2026-07-30. They are unaudited and will be replaced once the reviewed quarterly or half-year report is filed.
Latest-quarter revenue up +130.0% versus the same quarter a year ago.

💡 Korea Market 101
⚖️ Valuation — Cheap or Expensive?
| Metric | Value | How to read it |
|---|---|---|
| P/E (trailing) | 19.5x | Price vs last 12 months’ earnings |
| P/E (forward) | 3.7x | Price vs next 12 months’ expected earnings — growth hopes baked in |
| P/S | 4.2x | Price vs revenue — for high-growth names with thin profits |
| P/B | 3.8x | Price vs book value — below 1x means priced under liquidation value |
| PEG | 0.2x | P/E ÷ growth — near 1 is fair for the growth; above 2 is demanding |
| EV/EBITDA | 7.1x | Enterprise value (incl. debt) vs cash generation |
Peer comparison
| Name | Mkt Cap | P/E | Fwd P/E | P/S |
|---|---|---|---|---|
| SamsungElec | ₩1,625.22T | — | 3.7x | 3.3x |
| SK hynix | ₩1,064.78T | — | 3.3x | 5.6x |
| Taiwan Semiconductor Manufactur | $2,144.14B | 32.5x | 19.0x | 0.5x |
| Micron Technology, Inc. | $1,062.49B | 21.3x | 6.1x | 11.8x |
💡 Korea Market 101
🎯 Street Consensus
- Price target (mean): ₩470,156
- Target high / low: ₩725,000 / ₩210,000
- Implied upside: +90.0%
- Rating: Strong Buy (1.4/5)
- Analysts covering: 36
- Next earnings: 2026-10-28
💡 Korea Market 101
📉 Price Action — Technical Check

| Indicator | Value | How to read it |
|---|---|---|
| RSI (14d) | 61.1 | Above 70 overbought · below 30 oversold |
| vs 60-day MA | -14.5% | Above/below the medium-term trend |
| vs 200-day MA | +22.6% | Above/below the long-term trend |
| Golden/death cross | 50-day above 200-day (bullish alignment) | 50-day MA crossing above (golden) or below (death) the 200-day |
| Volume (vs 20d avg) | 0.8x | 2x+ means a spike in market attention |
💡 Korea Market 101
📰 Recent News
- Why is Samsung Electronics stock plunging today? — Investing.com
- South Korean shares tumble as yield spike, Middle East tensions hit Samsung, SK Hynix — KED Global
- Samsung Electronics (KOSE:A005930) Moved Today, What Is Catching Investors’ Attention? — Yahoo Finance
- Samsung Electronics (KOSE:A005930) Stock Looks Reasonable On Earnings But Stretched After 322% Run — simplywall.st
- Samsung, SK Hynix stocks sink 9%: why Micron’s rout is spreading to South Korea — TradingView
- Samsung Executive Stock Tracking Site Emerges — 조선일보
How to read these headlines
The common thread is a memory-sector-wide risk-off move: Micron’s disappointing read-through, a bond yield spike, and Middle East tensions have combined to hit sentiment across Korean chipmakers, dragging Samsung and SK Hynix down together. Layered on top is a valuation debate — after a reported 322% run, some now see the stock as “stretched,” meaning any wobble in chip demand expectations could weigh on shares even if fundamentals remain intact, making the upcoming earnings report worth confirming closely.
Headlines are credited to their publishers — click a headline to open the original article. The commentary is written by this site and does not represent the views of any publisher.
💡 Korea Market 101
🔭 Scenarios & What to Watch
Next earnings land October 28, 2026 — a key checkpoint for whether the forward-PER-implied earnings surge materializes. Watch memory chip pricing trends and demand signals from peers, RSI at 61.1 (not yet overbought), and the tension between the below-MA60 pullback and above-MA200 uptrend. USD-based investors should also track KRW moves, which affect translated returns independent of the stock’s local performance.
Next earnings on 2026-10-28 (in 70 days) — guidance usually decides the stock’s direction more than the reported quarter.
💡 Korea Market 101
📚 All stock analysis · More on Samsung Electronics · Market report for this session
Stock report · published 2026-08-19 16:01 KST
For information only — a summary of public data, not a recommendation to buy or sell any security. Source data (Yahoo Finance and others) may be delayed or contain errors. All investment decisions are your own responsibility.
Leave a Reply