Daily Korea Market Report · as of 2026-07-27 close
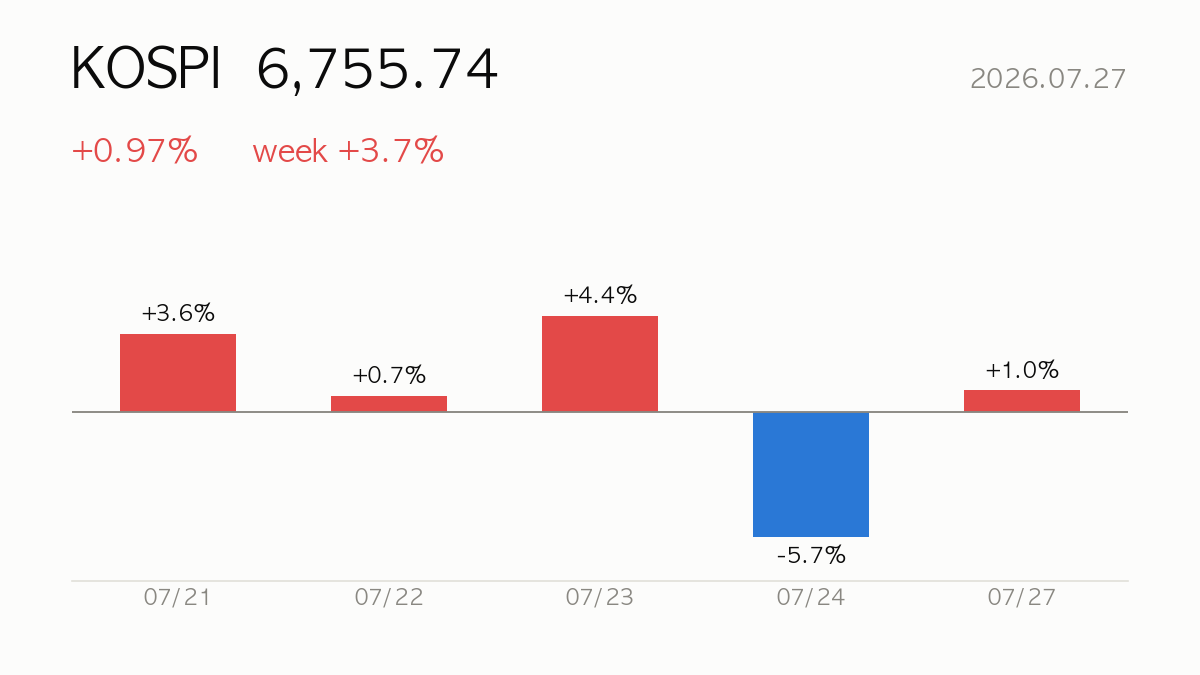
The KOSPI closed at 6,755.74, up 0.97% on the day. It remains -25.9% below its recent peak. Our system’s Korea crash gate is currently blocking new entries — a high-volatility regime. Overall regime call: RISK-OFF.
|
KOSPI Close
6,755.74
+0.97% · -25.9% vs peak
|
Volatility (20d realized)
73.2
Panic ≥40
|
USD/KRW
1,469.3
-0.32% · 1M -5.0%
|
Regime
RISK-OFF
🔴 Entries blocked
|
📝 Market Wrap
■ Market Overview & Leaders
KOSPI closed at 6,755.74 (+0.97%), extending its rebound as easing Hormuz Strait tensions sent oil prices sharply lower ahead of the Fed meeting. KOSDAQ outpaced with a +2.21% surge to 764.73. Regional peers were mixed: Nikkei +0.50%, TAIEX -0.05%, S&P 500 futures barely higher (+0.05%). The won firmed 0.32% against the dollar to 1,469.28. NAVER (+8.4%) and Woori Financial (+7.3%) led gainers alongside Korean Air, Samsung SDS, and SK Hynix, while energy-linked names cratered — Hanwha Solutions (-12.7%), SK Innovation (-10.3%), and S-Oil (-9.8%) sank as crude weakened sharply.
■ Flows & Breadth
Large-cap breadth was essentially split — 20 advancers versus 19 decliners — a notable divergence from the headline index’s near-1% gain, underscoring how a handful of heavyweights (NAVER, SK Hynix) drove the tape. Headlines point to leveraged ETF-related supply-demand pressure amplifying recent swings. The system’s high-volatility risk gate remains active, signaling elevated caution.
■ Takeaway
With breadth this narrow, the rally looks vulnerable to reversal if leadership names falter — foreign investors should stay alert to concentration risk even as Citi flags a longer-term rebound path. 📈
📊 Market Snapshot
| Index | Close | 1D | 5D | 1M | vs Peak |
|---|---|---|---|---|---|
| KOSPI | 6,755.74 | +0.97% | +3.7% | -24.4% | -25.9% |
| KOSDAQ | 764.73 | +2.21% | +2.0% | -13.9% | -37.6% |
| S&P 500 | 7,411.98 | +0.05% | -0.6% | +0.7% | -2.6% |
| USD/KRW | 1,469.3 | -0.32% | -1.2% | -5.0% | -5.5% |
| Nikkei 225 | 64,931 | +0.50% | +1.2% | -10.3% | -10.3% |
| Taiwan TAIEX | 43,634 | -0.05% | +2.8% | -5.7% | -8.6% |
💡 Korea Market 101

🏷️ Large-Cap Movers (Today)
| Gainers | Chg | Losers | Chg |
|---|---|---|---|
| NAVER | +8.4% | 한화솔루션 | -12.7% |
| 우리금융지주 | +7.3% | SK이노베이션 | -10.3% |
| 대한항공 | +3.9% | S-Oil | -9.8% |
| 삼성에스디에스 | +3.8% | 포스코인터내셔널 | -6.4% |
| SK하이닉스 | +3.2% | HMM | -4.6% |
Large-cap breadth: 20 up · 19 down (of 40)
💡 Korea Market 101
🔄 Sector Rotation
| Sector | 1M | 3M | Score | Type |
|---|---|---|---|---|
| 소비재 | +14.1% | -3.1% | 4.5 | Growth |
| 필수소비재 | +12.9% | -0.1% | 4.4 | Defensive |
| 에너지 | +25.3% | +1.0% | 3.1 | Defensive |
| 통신/인터넷 | +4.2% | -13.6% | -3.0 | Growth |
| 금융 | +2.6% | -20.2% | -3.5 | Defensive |
| 부동산/리츠 | +6.3% | -10.5% | -6.4 | — |
| 화학/소재 | +2.5% | -20.4% | -7.0 | Growth |
| 방산/산업재 | -3.2% | -23.6% | -8.7 | — |
💡 Korea Market 101
📐 Market Breadth
(38 names)
| Above 200-DMA | Above 50-DMA | Up over 1M | 52-wk highs | 52-wk lows |
|---|---|---|---|---|
| 63% | 37% | 45% | 0% | 0% |
💡 Korea Market 101
📰 Headlines (English coverage of Korea)
- Kospi index and US stock futures jump as Hormuz talks send oil prices plunging ahead of Fed meeting — Fortune
- Explaining South Korea’s Stock Market Boom — Korea Economic Institute of America –
- Oil prices sink 4% while Asian shares gain as Chinese chipmaker CXMT soars in Shanghai trading debut — New Haven Register
- Investor appetite spreads beyond chips as Alphabet AI spending plan lifts Kospi back above 7,000 — KED Global
- Inside South Korea’s world-beating bear market — Reuters
- KOSPI Plunge Blamed on Supply-Demand, Leveraged ETFs — 조선일보
- Kospi to 10,000: South Korean equities poised to rebound after brutal sell-off, says Citi — CNBC
- Why South Korea’s stock market is driving wild Wall Street swings — Business Insider
💡 Korea Market 101
🌐 Macro Dashboard
| Indicator | Level | 1M | Signal |
|---|---|---|---|
| US 10Y yield | 0.76 | — | — |
| Dollar Index (DXY) | 120.53 | -0.3% | — |
| Gold | 4,100 | +1.7% | — |
| WTI Crude | 84.40 | +17.4% | ▼ |
| Bitcoin | 65,367 | +2.1% | — |
💡 Korea Market 101
🌡️ Regime & Risk Diagnosis
- Regime call: RISK-OFF — Risk-off — investors are sheltering from risk assets (realized vol 72, USD/KRW 1,469)
- Allocation guide: Defensive stance: reduced equity exposure, higher cash allocation
- Crash gate: 🔴 Blocking new entries
- 5-day index return -1.9% (threshold -8%) · 20-day realized vol 73.2 (threshold 40) — the system automatically resumes new entries once both metrics normalize.
💡 Korea Market 101
🎯 System Watchlist
Sectors in focus: 필수소비재 1 names · 통신/인터넷 1 names · 화학/소재 1 names
| Name | Mkt | Sector | Style | Score | Target | Stop | Status |
|---|---|---|---|---|---|---|---|
| 오리온 | KR | 필수소비재 | Swing | 90 | +29.2% | -14.6% | Watching |
| LG유플러스 | KR | 통신/인터넷 | Swing | 90 | +20.0% | -10.0% | Watching |
| 롯데정밀화학 | KR | 화학/소재 | Swing | 90 | +20.0% | -10.0% | Watching |
💡 Korea Market 101
🩺 System Health Check
- Risk gate: 🔴 Blocking new entries
- [KR Crash Gate] 실현변동성 20일 73.2 ≥ 40 — 패닉 국면, 신규 진입 차단
- Circuit breaker: 🟢 Normal
- Entry attempts blocked by the gate today: 249
💡 Korea Market 101
🤖 System Trading Status
No positions closed today.
2 open positions — average unrealized P&L -2.36% (0 winning / 2 losing)

💡 Korea Market 101
Published 2026-07-27 15:51 KST
For information only — not investment advice or a solicitation. All investment decisions are your own responsibility.
Leave a Reply